Review
. 2023 Jul;209(4):541-561.
doi: 10.1007/s00359-022-01610-w. Epub 2023 Jan 7.

Optic flow based spatial vision in insects

Affiliations
Review

Optic flow based spatial vision in insects

Martin Egelhaaf. J Comp Physiol A Neuroethol Sens Neural Behav Physiol. 2023 Jul.

Abstract

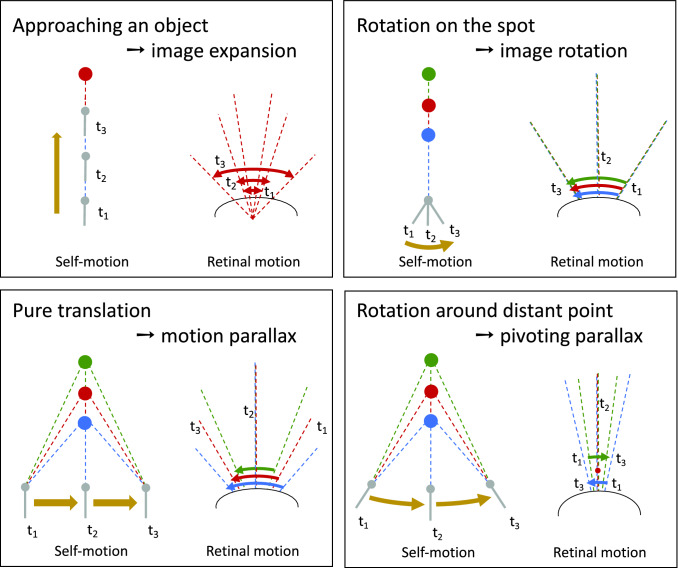
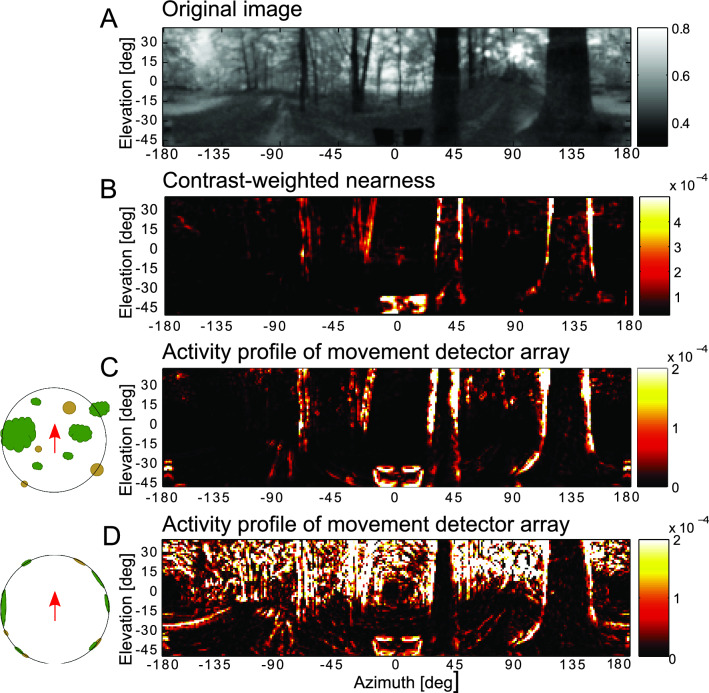
The optic flow, i.e., the displacement of retinal images of objects in the environment induced by self-motion, is an important source of spatial information, especially for fast-flying insects. Spatial information over a wide range of distances, from the animal's immediate surroundings over several hundred metres to kilometres, is necessary for mediating behaviours, such as landing manoeuvres, collision avoidance in spatially complex environments, learning environmental object constellations and path integration in spatial navigation. To facilitate the processing of spatial information, the complexity of the optic flow is often reduced by active vision strategies. These result in translations and rotations being largely separated by a saccadic flight and gaze mode. Only the translational components of the optic flow contain spatial information. In the first step of optic flow processing, an array of local motion detectors provides a retinotopic spatial proximity map of the environment. This local motion information is then processed in parallel neural pathways in a task-specific manner and used to control the different components of spatial behaviour. A particular challenge here is that the distance information extracted from the optic flow does not represent the distances unambiguously, but these are scaled by the animal's speed of locomotion. Possible ways of coping with this ambiguity are discussed.

Keywords: Behavioural control; Motion detection; Optic flow; Spatial vision.


Conflict of interest statement

The author declares that he has no conflict of interest.

Figures

Fig. 1
Fig. 1
Optic flow induced by different types of self-motion in specific environments. Schematic representation of an animal's self-movement relative to three objects at different distance (left diagram in each box) and the corresponding OF (right diagram in each box) from a top perspective. The left diagrams show the position of the animal at three different times (t1, t2, t3) and the angle relative to the longitudinal axis of the body at which the objects are seen. The arrows in the right diagrams indicate the retinal image shifts of the objects induced by three types of self-motion and the corresponding OF at the respective time points. When approaching an object translationally, the object appears to become larger and larger as the distance decreases (image expansion); with pure rotation, the objects shift with the same angular velocity regardless of distance. If the animal translates e.g., sideways past objects of different distances, the corresponding retinal image speed depends on the distance, with the closer object moving faster than the more distant ones; this kind of motion parallax thus provides distance information relative to the animal. A rotation of the animal around a distant point (pivoting point) in the environment (here the red object) corresponds to a combined rotational and translational movement in body coordinates; as a consequence, the pivoting point does not move at all, while the near and far object move on the retina in different directions; the OF associated with such a pivoting parallax thus contains distance information relative to the pivoting point, rather than relative to the animal
Fig. 2
Fig. 2
Saccadic flight and gaze strategy. A Inset: Trajectory of a flight of a bumblebee as seen from above after leaving an inconspicuous feeder placed between three textured cylinders (black objects). Each dot and line indicate the position of the bee in space and the viewing direction of its head at time intervals of 20 ms, respectively. The time is colour-coded (given in ms after the start of the flight at the feeder). Upper diagram: Yaw orientation of longitudinal axis of body (black line) and head (red line) of the flight trajectory shown in the inset. Note that step-like, i.e., saccadic direction changes, are more pronounced for the head than for the body. Bottom diagram: Yaw velocity of body (black line) and head (red line) of the same flight (Data from Mertes et al. ; Boeddeker et al. 2015). B Translational and rotational prototypical movements of honeybees during cruising and local landmark navigation in a flight arena. Flight sequences while the bee was searching for a visually inconspicuous feeder located between three cylindrical landmarks can be decomposed into nine prototypical movements using clustering algorithms. Each movement prototype is depicted in a coordinate system as explained by the inset. The lengths of the arrows indicate the size of the corresponding velocity component. Percentage values provide the relative occurrence of each prototype. More than 80% of flight-time correspond to a set of translational prototypical movements (light blue background) and only less than 20% have a systematic non-zero rotational velocity corresponding to the saccades (light red background) (Data from Braun et al. 2012)
Fig. 3
Fig. 3
Flight speed controlled by spatial layout of the environment. A Control of translational velocity in free-flying blowflies in environments with different spatial characteristics. Boxplots of the translational velocity in flight tunnels of different widths, in a flight arena with two obstacles and in a cubic flight arena (sketched below data). Translation velocity strongly depends on the geometry of the flight arena. B Boxplots of the retinal image velocities within intersaccadic intervals experienced in the fronto-ventral visual field (see sketches above data diagram) in the different flight arenas. In this part of the visual field, the intersaccadic retinal velocities are kept roughly constant by regulating the translation velocity according to clearance with respect to environmental structures. The upper and lower margins of the boxes in A and B indicate the 75th and 25th percentiles, and the whiskers the data range (data from Kern et al. 2012)
Fig. 4
Fig. 4
Nearness to obstacles indicated by retinal optic flow during intersaccadic intervals. A Schematic of a sample flight trajectory of a bumblebee in a flight tunnel with cylindrical obstacles. The inset indicates the three components of rotational movement. B Time resolved roll, pitch and yaw orientation of the bee’s thorax and head in world coordinates for the flight shown in A. Whereas the roll and pitch angles of the body change tremendously during the flight manoeuvres, the corresponding head angles stay relatively constant due to rapid head–body coordination. However, the yaw angle of both body and head need to change to allow the bee to fly around the obstacles; whereas the yaw orientation of the head changes rapidly in a saccadic fashion and only much less during intersaccadic intervals, the changes of body orientation are more sluggish. C Upper diagram: Sample snapshot of the total OF for the full spherical field of view at a given instant of time during an intersaccadic interval based on the head trajectory and orientation. Bottom diagram: Snapshot of the nearness map for the head trajectory and orientation at the same instant of time. The spatial map of intersaccadic OF generated from the head data closely reflects the nearness map that represents the geometric profile of the environment with the nearby obstacles being more salient in the OF map than the more distant ones (Data from Ravi et al. 2022)
Fig. 5
Fig. 5
Gap negotiation. Bumblebees are able to relate the width and clearance of a gap to their body-size when they want to pass it. The experimental analysis was done in flight tunnels with an obstructing wall either containing a gap with a barrier behind it in a variable distance (A) or a gap of variable width (D). In either constellation bumblebees decelerate at some distance to the wall with the gap and approached the gap with increasing lateral displacements depending on distance of the barrier to the gap (B) or the width of the gap (not shown). The duration of these lateral scanning manoeuvres containing motion parallax information increase with decreasing distance between the gap and the barrier (C). The bees are likely to use this parallax information to assess the distance between gap and barrier and/or whether the gap was sufficiently wide to be able to fly through headfirst in normal flight orientation or whether it had to pass in an oblique orientation (E). Because the wingspan is larger than the body length, the bumblebees flew almost sideways through narrow gaps (F) (Data from Ravi et al. 2019, 2020)
Fig. 6
Fig. 6
Estimation of flight distances: Path integration in bees. Honeybees measure distances in terms of OF generated during flight and communicate this information to their hive mates by the waggle dance. Behavioural analysis revealed how honeybees estimate the distance between their hive and a food source. A Experimental layout for experiments using flight tunnels (left diagrams) and probabilities with which a round dance (R; green bars) or a waggle dance (W; blue bars) was performed by the bees in the respective situations and, if applicable, duration of the waggle dance, with which the distance between food source and nest perceived by the bee is indicated (right diagrams). The walls of the tunnel were either covered with a texture that contained vertically oriented (Exp. A, Exp. B, Exp. D) or horizontally aligned stripes (Exp. C). The bees were trained to collect sugar water from a food source (indicated by red object). When the food source was placed at the entrance of the tunnel (Exp. A), the bees performed mainly round dances after returning to their hive, signalling a short distance to the food source. When the food source was placed at the end of the tunnel containing vertically oriented texture (Exp. B), the returning bees performed mainly waggle dances, signalling much larger distances to the hive, although the actual travel distance was not much larger. A food source at the same distance, however, located in a tunnel with horizontally oriented stripes (Exp. C), again led mainly to round dances. The main difference between Exp. B and Exp. C is that in the former much OF is evoked on the eyes of the bee while flying along the tunnel, whereas in the latter case, there is only little OF, because the contours are oriented along the flight direction. When the tunnel covered with vertical contours and the food source close to its end is placed near to the hive (Exp. D), mainly waggle dances are performed, which are shorter than those performed in Exp. B (compare blue bars). These experiments suggest that travelled distance is measured in terms of OF. B Calibration of the odometer of the bee. Mean duration of waggle dances elicited by outdoor feeders at various distances to the hive. Also shown are the mean durations of waggle dances measured in Exp. B and Exp. D and their equivalent outdoor flight distances, as read from the regression line. These findings show that OF-based distance measurements e.g., in the context of path integration depend much on the spatial layout of the environment and are thus highly ambiguous (Adapted from Srinivasan et al. 2000)
Fig. 7
Fig. 7
Optic flow processing in insect nervous system. Schematic of the visual motion pathways involved in the processing of OF-based spatial information. Shown is only one brain hemisphere including the central complex located centrally in the protocerebrum. The scheme is largely based on the visual pathway of flies, even though individual elements have been adopted from studies on other insects. The changes in brightness induced by motion signals are perceived in the retina by the retinotopic array of photoreceptors R1–R6 and then temporally filtered in the first visual neuropil, the lamina, by different types of L-cells. Thereby the visual information is divided into an ON (red) and OFF channel (green). Local motion detection takes place in the ON and OFF channels in networks of local retinotopic interneurons (Tm, Ti) in the medulla. The retinotopically organised outputs of the motion detection networks are formed by the T4 (ON channel) and T5 cells (OFF channel), which receive their input signals in the medulla (T4 cells) or in the anterior part of the lobula complex, the lobula (T5 cells). At the level of the lobula complex, the different pathways for OF-based spatial vision segregate at least partially. In the lobula plate, retinotopic motion information mediated by the T4 and T5 cells is spatially pooled by the lobula plate tangential cells (LPTCs), which, with their large receptive fields, provide global OF information as induced by the animal's own motion. Part of these cells are connected to descending neurons in the posterior slope region (PS) in the protocerebrum; these descending neurons are involved in mediating a wide range of components of course control in three-dimensional environments. Movement information, but also other visual information, is transmitted in the lobula to the retinotopically organised lobula columnar (LC) cells and, if applicable, additionally in the lobula plate to the lobula plate—lobula columnar (LCLP) cells. Some of these cells act as projection neurons, transmitting looming information to the optic glomeruli of the posterior lateral protocerebrum (PLP) and posterior ventrolateral protocerebrum (PLVP), from where this information is transmitted via dedicated descending neurons to control escape as well as landing behaviour. OF information required for distance measurements in the context of OF-based path integration is conveyed from the lobula complex into the lateral accessory lobe (LAL), from where it is fed via the noduli into the intricate neuronal circuits of the central complex. The information about the integrated path distance, suitably combined with directional information, is transmitted via the LAL and descending neurons to control navigational behaviour
Fig. 8
Fig. 8
Local vs. spatially integrated optic flow representation. A Time averaged velocity responses of a wide-field neuron in the blowfly third visual neuropile, the lobula plate, to periodic stripe patterns of different spatial wavelengths (red curve: 6.6°; blue curve: 21.5°; green curve: 36.3°) moving horizontally in the neuron’s preferred direction. Velocity-response curves strongly depend on the pattern properties; their optima are shifted to higher velocities with increasing spatial wavelength of the pattern (Data from Eckert 1980). B Consequences of dendritic integration on the representation of visual motion: Schematic of a directionally selective wide-field neuron with two branches of its dendrite, the axon and the axon terminal. The wide-field neuron receives retinotopically organized input from many local motion sensitive elements (vertical lines terminating with synapses indicated by red dots (excitatory synapses) and blue dots (inhibitory synapses) on the dendrite). Because of this input, the cell is excited by motion in its preferred direction and inhibited by motion in its null direction. Even when the velocity of motion is constant, the activity induced by the local movement sensitive elements is modulated depending on the texture of the stimulus pattern within their respective receptive field. Traces on the right indicate the time-dependent signals of three local input elements of the wide-field neuron. By dendritic pooling of many local elements, this pattern dependence in the time course of the responses is reduced (left trace)
Fig. 9
Fig. 9
Local motion measurements represent contrast weighted nearness in natural environments. Encoding of spatial information by two-dimensional arrays of local movement detectors during translatory locomotion in a natural environment. All images represent one instant of time during a longer translation sequence. A Original input image (after a nonlinear Naka-Rushton-like transformation of brightness values). B Contrast-weighted nearness map: The nearness (i.e., the inverse distance of the observer to any point in the 3D environment) is multiplied by the local contrast at the corresponding image location, resulting in the largest contrast-weighted nearness values at the edges of nearby objects (colour code in arbitrary units). C Activity profile of the array of movement detectors while the observer moves through a natural environment staggered in depth (see inset). The activity profile is given by the absolute values of horizontally and vertically aligned local movement detectors; model simulations based on an elaborated version of the correlation-type movement detector (colour code arbitrary units). The activity profile reflects the contrast weighted nearness structure of the three-dimensional environment. D Activity profile of the array of movement detectors at one instant of translatory motion after the depth structure of the forest environment has been equalized by projecting it on the surface of a sphere (see inset). Model simulation as in C. The activity profile now reflects all contours in the environment irrespective of their distance (Data from Schwegmann et al. 2014a, b)

Similar articles

Cited by

References

    1. Ache JM, Namiki S, Lee A, Branson K, Card GM. State-dependent decoupling of sensory and motor circuits underlies behavioral flexibility in Drosophila. Nat Neurosci. 2019;22:1132–1139. doi: 10.1038/s41593-019-0413-4. - DOI - PMC - PubMed
    1. Ache JM, Polsky J, Alghailani S, Parekh R, Breads P, Peek MY, Bock DD, von Reyn CR, Card GM. Neural basis for looming size and velocity encoding in the Drosophila giant fiber escape pathway. Curr Biol. 2019;28:1073–1081. doi: 10.1016/j.cub.2019.01.079. - DOI - PubMed
    1. Baird E. Obstacle avoidance in bumblebees is robust to changes in light intensity. Anim Cogn. 2020;23:1081–1086. doi: 10.1007/s10071-020-01421-z. - DOI - PMC - PubMed
    1. Baird E, Dacke M. Visual flight control in naturalistic and artificial environments. J Comput Physiol A. 2012;198:869–876. doi: 10.1007/s00359-012-0757-7. - DOI - PubMed
    1. Baird E, Dacke M. Finding the gap: a brightness-based strategy for guidance in cluttered environments. Proc R Soc B Biol Sci. 2016;283:20152988. doi: 10.1098/rspb.2015.2988. - DOI - PMC - PubMed

Publication types

LinkOut - more resources