. 2023 Jan;55(1):143-157.
doi: 10.1038/s12276-022-00919-5. Epub 2023 Jan 6.

Dnmt1/Tet2-mediated changes in Cmip methylation regulate the development of nonalcoholic fatty liver disease by controlling the Gbp2-Pparγ-CD36 axis

Affiliations

Dnmt1/Tet2-mediated changes in Cmip methylation regulate the development of nonalcoholic fatty liver disease by controlling the Gbp2-Pparγ-CD36 axis

Jangho Lee et al. Exp Mol Med. 2023 Jan.

Abstract

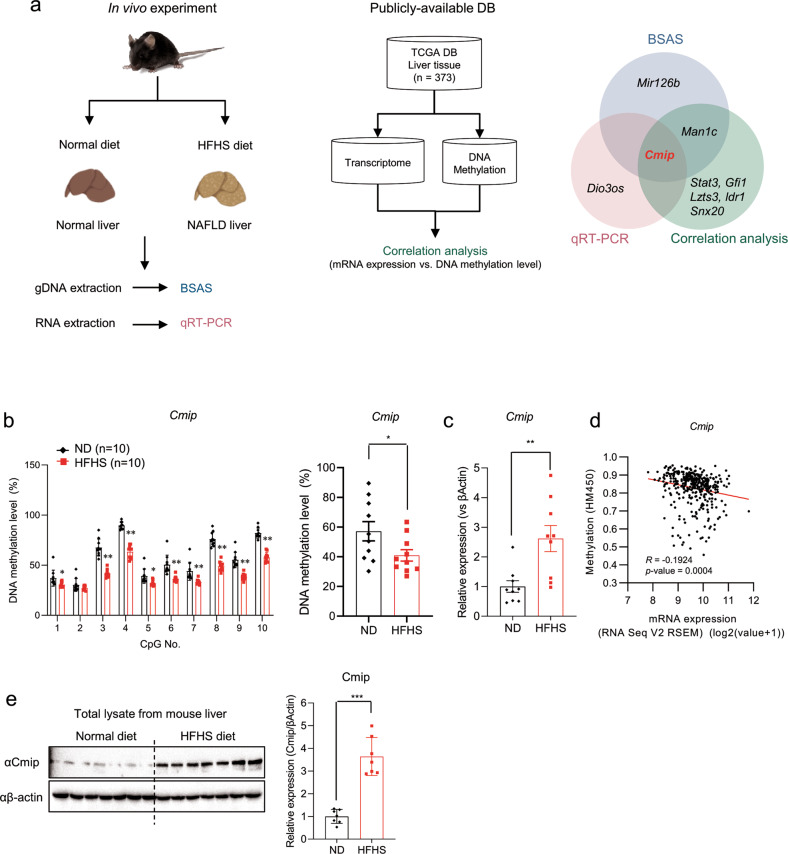
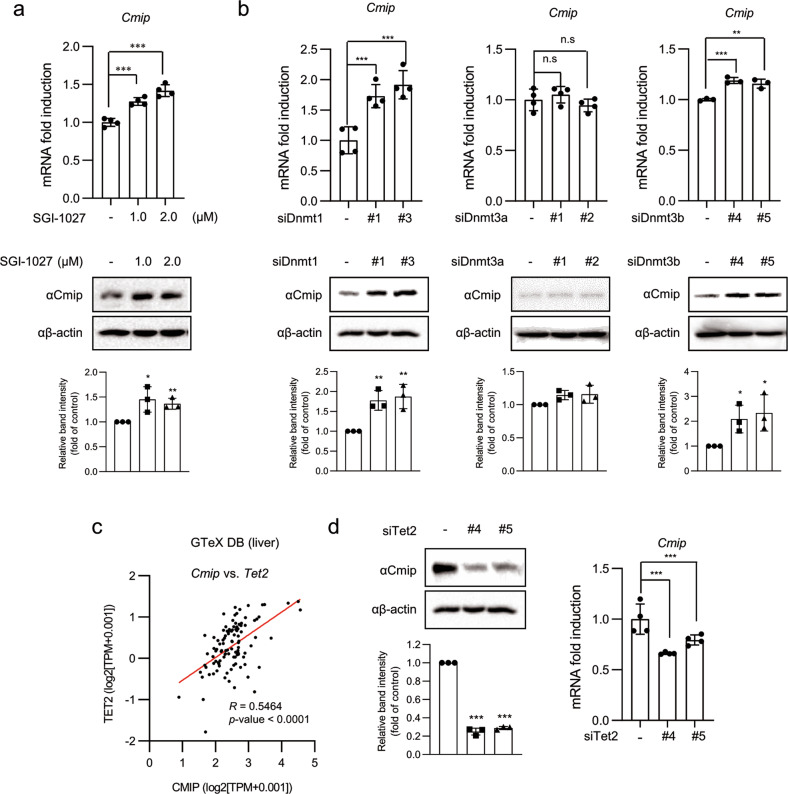
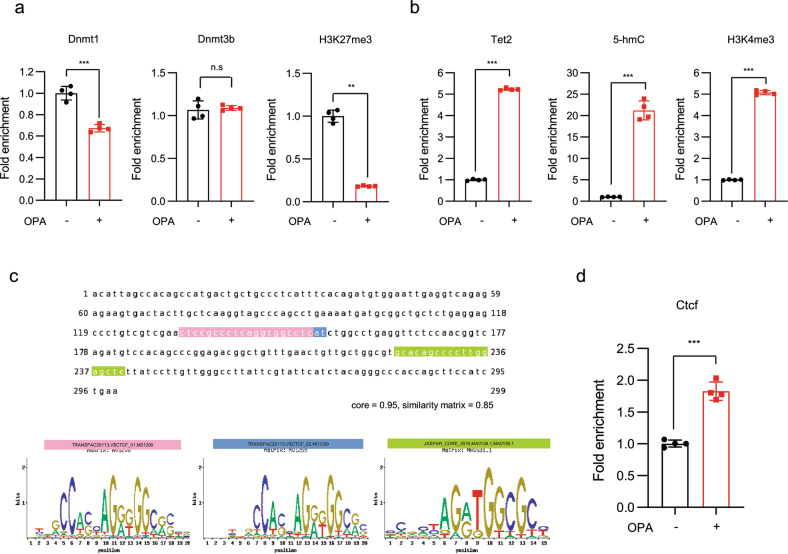
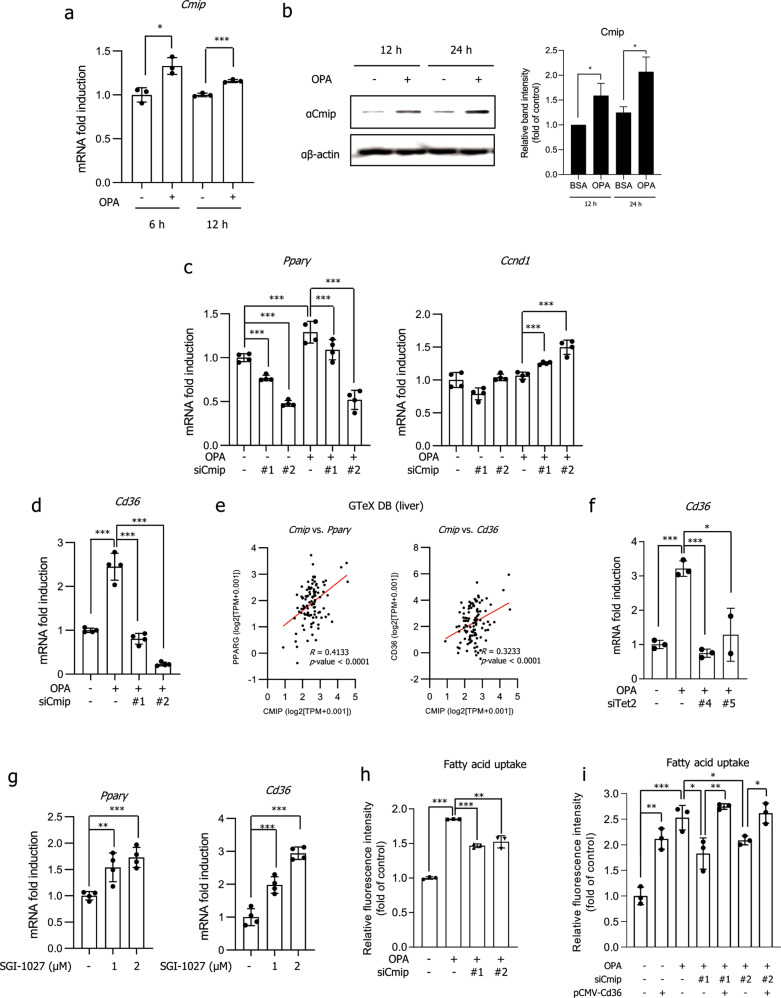
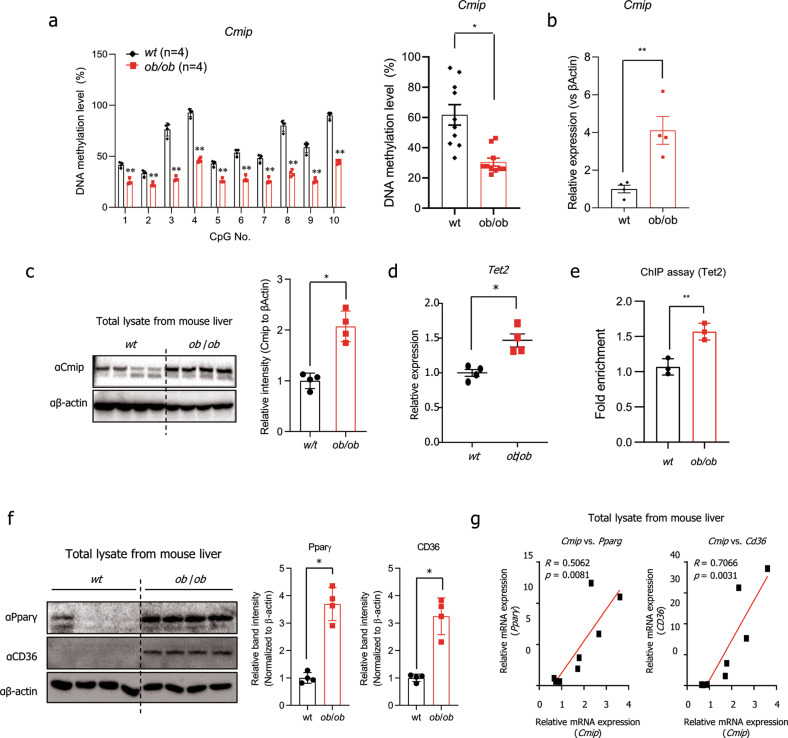
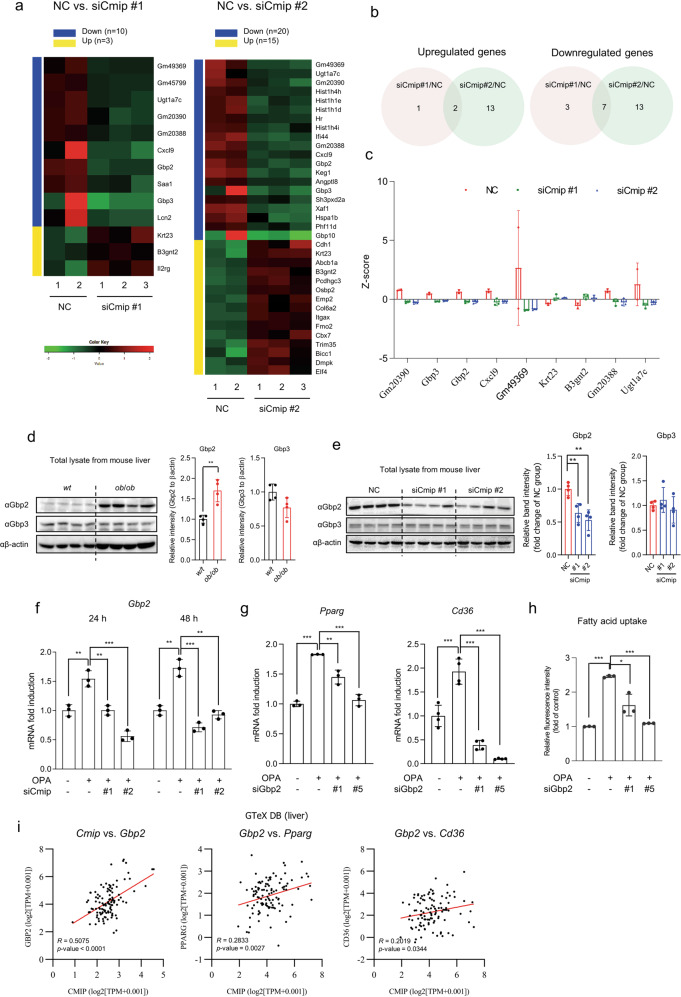
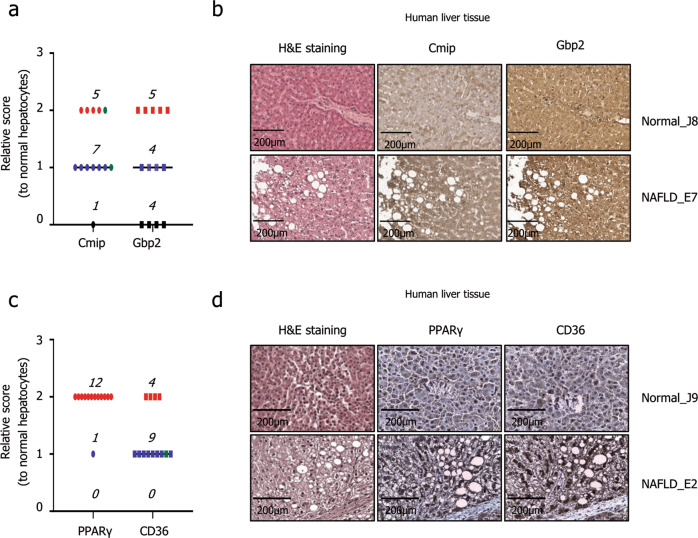
Dynamic alteration of DNA methylation leads to various human diseases, including nonalcoholic fatty liver disease (NAFLD). Although C-Maf-inducing protein (Cmip) has been reported to be associated with NAFLD, its exact underlying mechanism remains unclear. Here, we aimed to elucidate this mechanism in NAFLD in vitro and in vivo. We first identified alterations in the methylation status of the Cmip intron 1 region in mouse liver tissues with high-fat high-sucrose diet-induced NAFLD. Knockdown of DNA methyltransferase (Dnmt) 1 significantly increased Cmip expression. Chromatin immunoprecipitation assays of AML12 cells treated with oleic and palmitic acid (OPA) revealed that Dnmt1 was dissociated and that methylation of H3K27me3 was significantly decreased in the Cmip intron 1 region. Conversely, the knockdown of Tet methylcytosine dioxygenase 2 (Tet2) decreased Cmip expression. Following OPA treatment, the CCCTC-binding factor (Ctcf) was recruited, and H3K4me3 was significantly hypermethylated. Intravenous Cmip siRNA injection ameliorated NAFLD pathogenic features in ob/ob mice. Additionally, Pparγ and Cd36 expression levels were dramatically decreased in the livers of ob/ob mice administered siCmip, and RNA sequencing revealed that Gbp2 was involved. Gbp2 knockdown also induced a decrease in Pparγ and Cd36 expression, resulting in the abrogation of fatty acid uptake into cells. Our data demonstrate that Cmip and Gbp2 expression levels are enhanced in human liver tissues bearing NAFLD features. We also show that Dnmt1-Trt2/Ctcf-mediated reversible modulation of Cmip methylation regulates the Gbp2-Pparγ-Cd36 signaling pathway, indicating the potential of Cmip as a novel therapeutic target for NAFLD.


Conflict of interest statement

The authors declare no competing interests.

Figures

Fig. 1
Fig. 1. Hypomethylation of the Cmip intron 1 region increases its mRNA and protein expression levels in high-fat high-sucrose diet-supplemented mice.
a Experimental design to identify genes that regulate nonalcoholic fatty liver disease (NAFLD) by DNA methylation. C57BL/6N mice were fed an HFHS diet or a normal diet and were sacrificed 12 weeks later. gDNA or total RNA was extracted from liver tissues and used for RRBS or qRT‒PCR experiments to measure DNA methylation or mRNA expression levels, respectively (left panel). The correlation between the transcriptome and DNA methylome of human liver tissues was analyzed using TCGA DB (liver tissue, n = 373, RNA-seq and HM450K methylation data from GDAC Firehose) (middle panel). Venn diagram shows shared or unique genes in each of the three analyses (right panel). BSAS bisulfite amplicon sequencing, qRT‒PCR quantitative reverse transcription PCR, gDNA guide DNA, HFHS high-fat high-sucrose. b Schematic of the Cmip methylation status in the liver tissues of mice fed either a normal diet (ND) or an HFHS diet. The methylation status of CpG islands of the Cmip intron 1 region from +117,326,061 to 117,325,350 was measured by BSAS in both the ND- and HFHS diet-supplemented groups. The methylation level of each site was calculated (left panel). The total methylation level between the ND- and HFHS diet-fed groups was compared (right panel). The values presented are the means ± SEs of ten mice per group. *p < 0.05, **p < 0.01, and ***p < 0.001; Student’s t-test. c Cmip expression in the livers of mice fed either the ND or HFHS diet. The values presented are the means ± SEs of ten independent mice per group. ***p < 0.001; Student’s t-test. d Correlation between CMIP mRNA expression and DNA methylation levels in human liver tissues (n = 373). Pearson’s correlation analysis was performed. e The protein contents of Cmip in the liver tissues of mice fed either the ND or HFHS diet. Cmip expression was measured in ND and HFHS diet-fed mice. The protein expression of Cmip was measured by western blotting. The liver lysates were immunoblotted with the indicated antibodies (left panel). The intensities of the protein bands obtained from the western blot assay were quantified with ImageJ (right panel) and normalized with respect to the intensity of β-actin. The relative fold intensity was calculated as the sum of the normalized intensities from both β-actin and Cmip. ***p < 0.001; Student’s t-test.
Fig. 2
Fig. 2. Dnmt1 and Tet2 reversely regulate Cmip expression.
a The effect of the DNMT inhibitor (DNMTi) SGI-1027 on Cmip expression. Cmip expression levels were increased following SGI-1027 exposure. Cells were treated with SGI-1027 at the indicated concentrations for 24 h. mRNA expression of Cmip was measured by qRT‒PCR. The values presented are the means ± SDs of three independent experiments (upper panel). The level of Cmip protein was detected by western blot analysis, and the intensities of the protein bands were quantified using FusionCapt Advance Solo 7 software (lower panel). *p < 0.05, **p < 0.01, and ***p < 0.001; one-way ANOVA followed by Tukey’s multiple test. b The effect of Dnmt knockdown on Cmip expression in AML12 cells. The values presented are the means ± SDs of three independent experiments (upper panels). Cmip protein levels were measured by western blotting, and the intensities of the protein bands were quantified using FusionCapt Advance Solo 7 software (lower panels). n.s not significant (p < 0.05), *p < 0.05, **p < 0.01, and ***p < 0.001; Student’s t-test. c The correlation of the relative influence between Cmip and Tet2 expression levels in human liver tissues (110 samples) from the Genotype-Tissue Expression (GTeX) database. The correlation between the expression of Cmip and Tet2 was expressed as the Pearson correlation coefficient (R). Pearson’s correlation analysis was performed. d The effect of Tet2 knockdown on Cmip expression in AML12 cells. The values presented are the means ± SDs of three independent experiments (right panel). Cmip protein levels were measured by western blotting, and the intensities of the protein bands were quantified using FusionCapt Advance Solo 7 software (left panel). ***p < 0.001; Student’s t-test.
Fig. 3
Fig. 3. Dnmt1 and Tet2/Ctcf reversibly occupy the CpG site in the Cmip intron 1 region.
a Dnmt1 occupancy and H3K27me3 methylation status in the Cmip intron 1 region in AML12 cells. The values presented are the means ± SDs of three independent experiments. *p < 0.05, ***p < 0.001, and n.s. nonsignificant; Student’s t-test. b Tet2, 5-hmC occupancy, and H3K4me3 methylation status in the Cmip intron 1 region in AML12 cells were measured using chromatin immunoprecipitation (ChIP) assays. The values presented are the means ± SDs of three independent experiments. *p < 0.05 and ***p < 0.001; Student’s t-test. c Ctcf binding conserved sequences in the Cmip intron 1 region. The binding probability of Ctcf to the Cmip intron region (chr8; 117,325,151–117,325,330) was predicted by comparing the Ctcf conserved binding motif (M01200 and M01259 from TRANSFAC; MA0139.1 from JASPAR) and the sequence of the Cmip intron 1 region using the ConTra v3 web server (http://bioit2.irc.ugent.be/contra/v3). d Ctcf occupancy in the Cmip intron 1 region, measured using ChIP assays. The values presented are the means ± SDs of three independent experiments. *p < 0.05 and **p < 0.01; Student’s t-test.
Fig. 4
Fig. 4. Knockdown of either Cmip or Tet2 controls the Pparγ–Cd36 axis.
a, b Cmip expression in AML12 cells. AML12 cells were treated with oleic acid and palmitic acid (OPA) for 6, 12, or 24 h; total RNA was extracted; and mRNA expression of Cmip was measured by qRT‒PCR (a). The values presented are the means ± SDs of three independent experiments. *p < 0.05 and **p < 0.01 (right panel); Student’s t-test. The protein contents of Cmip were measured 12 and 24 h after OPA treatment in AML12 cells (left panel) and quantified through normalization to the content of β-actin (b). *p < 0.05; Student’s t-test. c, d The effect of Cmip knockdown on Pparγ and Cd36 expression. Two sets of Cmip siRNA were transiently transfected into AML12 cells, total RNA was extracted, and the mRNA expression levels of Pparγ (c, left panel), Ccdn1 (c, right panel), and Cd36 (d) were measured by qRT‒PCR. The values presented are the means ± SDs of three independent experiments. ***p < 0.001; Student’s t-test. e Correlation analysis based on data from public databases. Using the RNA-seq data of liver tissues from the Genotype-Tissue Expression database (n = 110), the relative influence between Cmip and Pparγ expression levels (left panel) and between Cmip and Cd36 expression levels (right panel) was analyzed via Pearson’s correlation analysis. f The effect of Tet2 knockdown on Cd36 expression. Two sets of Tet2 siRNA were transiently transfected into AML12 cells, total RNA was extracted, and the mRNA expression of Cd36 was measured by qRT‒PCR. The values presented are the means ± SDs of three independent experiments. *p < 0.05 and ***p < 0.001; Student’s t-test. g The effect of the DNMT inhibitor SGI-1027 on Pparγ and Cd36 expression. Cells were treated with SGI-1027 at the indicated concentrations for 24 h. mRNA expression of Pparγ (left panel) and Cd36 (right panel) was measured by qRT‒PCR. The values presented are the means ± SDs of three independent experiments. ***p < 0.001; Student’s t-test. h The effect of Cmip knockdown on fatty acid uptake into AML12 cells. **p < 0.01 and ***p < 0.001; Student’s t-test. i The effect of Cd36 overexpression under Cmip knockdown conditions. The Cd36 plasmid was transiently transfected following siCmip transfection. After 12 h, OPA was added, and the cells were incubated for an additional 12 h. The rate of fatty acid uptake into AML12 cells was measured. *p < 0.05, **p < 0.01, and ***p < 0.001; Student’s t-test.
Fig. 5
Fig. 5. Methylation alteration of Cmip controls hepatic lipid accumulation in ob/ob mice.
a The methylation status of ten CpG sites in the Cmip intron 1 region in either wildtype (wt) or ob/ob mouse liver tissues. Cmip methylation was measured by bisulfite amplicon sequencing (BSAS) in both wt and ob/ob mice (n = 4/group). The methylation level of each site was calculated (left panel). Total methylation levels between wt and ob/ob mice were compared (right panel). The values presented are the means ± SEs of four mice per group. **p < 0.01. Student’s t-test. b, c The level of Cmip expression in liver tissues from either wt or ob/ob mice as measured by qRT‒PCR. The values presented are the means ± SEs of four mice per group. *p < 0.05; Student’s t-test (b). The protein contents of Cmip were measured by western blotting. Liver lysates were immunoblotted with the indicated antibodies (left panel). The intensities of the protein bands obtained from the western blot assays were quantified using FusionCapt Advance Solo 7 software (right panel) and normalized with respect to the intensity of β-actin. The relative fold intensity was calculated as the sum of the normalized intensities from both β-actin and Cmip. *p < 0.05; Student’s t-test (c). d The expression of Tet2 in either wt or ob/ob mouse liver tissues. Tet2 mRNA expression was measured by qRT‒PCR. The values presented are the means ± SEs of four mice per group. *p < 0.05; Student’s t-test. e Tet2 occupancy in the Cmip intron 1 region in the livers of ob/ob and wt mice. The values presented are the means ± SDs of three independent experiments. **p < 0.01; Student’s t-test. f Pparγ and Cd36 expression in either wt or ob/ob mouse liver tissues, detected by western blotting (left panel). The intensities of the protein bands obtained from the western blot assays were quantified with FusionCapt Advance Solo 7 software and normalized with respect to the intensity of β-actin. The relative fold intensity was calculated as the sum of the normalized intensities from β-actin, Pparγ, and Cd36 (right panels). *p < 0.05; Student’s t-test. g Correlations (R) between Pparγ or Cd36 expression and Cmip expression in ob/ob and wt mouse livers. Pearson’s correlation analysis was performed.
Fig. 6
Fig. 6. Cmip knockdown ameliorates significant nonalcoholic fatty liver disease (NAFLD) pathological features in ob/ob mice.
a Scheme for the in vivo Cmip gene knockdown experiment. Eighteen C57BL6/J ob/ob mice were acclimated for a week and then divided into three groups: the control, siCmip#1, and siCmip#2 groups (six mice per group). The mice were intravenously injected with scrambled siRNA, Cmip siRNA#1, or Cmip siRNA#2 with jetPEI transfection reagents twice every 3 days. Two days after the last injection, the mice were sacrificed, and liver tissue was harvested for analysis. b, c Measurement of body weight gain and food intake. Negative control (NC; siCont), siCmip#1, or siCmip#2 was intravenously (IV) injected using the jetPEI system twice every 3 days. Body weight gain (b) and daily food intake (c) for 1 week were calculated, and the values presented are the mean ± SE. n = 4/group; n.s. nonsignificant; Student’s t-test. df Changes in NAFLD features following Cmip knockdown in ob/ob mice. Two days after the last IV injection, the mice were sacrificed, the livers were removed, and blood was collected through orbital bleeding. Hematoxylin and eosin (H&E) staining of mouse liver specimens was performed. Representative images at 100× magnification are shown (d, upper line), and the center of each image (square block) was observed at 400× magnification (d, lower line). Hepatic triglycerides (TGs) and serum levels of TGs total cholesterol, low-density lipoprotein (LDL) cholesterol, high-density lipoprotein (HDL) cholesterol, and aspartate transaminase (AST) were measured (n = 6/group) (f). The values presented are the mean ± SE. *p < 0.05, **p < 0.01, and n.s. nonsignificant; Student’s t-test. g mRNA expression of Cmip, Pparg, and Cd36 in Cmip knockdown ob/ob mice as measured by qRT‒PCR (n = 4/group). The values presented are the means ± SEs. *p < 0.05, **p < 0.01; Student’s t-test.
Fig. 7
Fig. 7. Gbp2 mediates the regulation of the PparγCd36 axis downstream of Cmip.
a Heatmap visualization of the differentially expressed genes (DEGs) between Cmip knockdown and negative control (NC) mice. Two Cmip siRNAs (siCmip#1 and siCmip#2) were used for in vivo Cmip knockdown. The significant DEGs were selected as follows: |log fold-change|≥1; p < 0.05. b Venn diagrams representing the overlap of the upregulated DEGs in siCmip#1 vs. NC and siCmip#2 vs. NC (left panel) and that of the downregulated DEGs (right panel). c The expression levels of overlapping DEGs (n = 9) in the livers of Cmip knockdown and NC mice. The expression levels of each gene were expressed as Z-scores. d Gbp2 and Gbp3 expression in liver tissues in either wildtype (wt) or ob/ob mice. The protein levels of Gbp2 and Gbp3 in liver tissues in wt or ob/ob mice were detected by western blotting (n = 4/group). **p < 0.01; Student’s t-test. The intensities of the protein bands obtained from the western blot assays were quantified with FusionCapt Advance Solo 7 software and normalized with respect to the intensity of β-actin. The relative fold intensity was calculated by the sum of normalized intensities from each protein band. *p < 0.05; Student’s t-test. e Western blots of Gbp2 and Gbp3 expression in Cmip knockdown mice (n = 4/group). The intensities of the protein bands were quantified with FusionCapt Advance Solo 7 software and normalized with respect to the intensity of β-actin. The relative fold intensity was calculated as the sum of the normalized intensities from each protein band. **p < 0.01; Student’s t-test. f Gbp2 mRNA expression in Cmip knockdown AML12 cells, measured following siCmip transfection in the presence of oleic acid and palmitic acid (OPA). The values presented are the means ± SDs of three independent experiments. **p < 0.01 and ***p < 0.001; Student’s t-test. g Pparγ and Cd36 mRNA expression in Gbp2 knockdown AML12 cells, measured following siGbp2 transfection in the presence of OPA. The values presented are the means ± SDs of three independent experiments. **p < 0.01 and ***p < 0.001; Student’s t-test. h Fatty acid uptake in Gbp2 knockdown AML12 cells, measured following Gbp2 siRNA transfection. *p < 0.05, **p < 0.01, and ***p < 0.001; Student’s t-test. i Correlations of the relative influence between CMIP vs. GBP2, GBP2 vs. PPARγ, and GBP2 vs. CD36 in human livers. Correlations were analyzed using transcriptome data of human liver tissues (n = 110) from the Genotype-Tissue Expression (GTeX) database. Correlations are expressed as Pearson correlation coefficients (R).
Fig. 8
Fig. 8. The expression of Cmip, Gbp2, Pparγ, and Cd36 in human hepatocytes with nonalcoholic fatty liver disease (NAFLD).
a Cmip and Gbp2 expression levels in the livers of patients with NAFLD compared with those in normal livers. Score 0, black circle; Score 1, blue circle; Score 3, red circle; focal score, green circle. b Representative images of Cmip and Gbp2 stained with hematoxylin and eosin. Scale bar = 200 µm. c Pparγ and Cd36 expression levels in the livers of patients with NAFLD compared with those in normal livers. Score 0, black circle; Score 1, blue circle; Score 3, red circle; focal score, green circle. d Representative images of Cmip and Gbp2 stained with hematoxylin and eosin. Scale bar = 200 µm.
Fig. 9
Fig. 9. Schematic representation of the core contents in this study.
The potential mode of action of Cmip in nonalcoholic fatty liver disease (NAFLD) development. The Cmip intron 1 region is hypermethylated by Dnmt1 in normal liver tissues; however, following lipid accumulation in the liver, Tet2 is recruited with Ctcf and alters the methylation status in that region of Cmip, sequentially increasing the expression of both its mRNA and protein levels. Finally, increased Cmip activates the signaling pathway involved in the Pparγ–Cd36 axis via Gbp2, consequently accelerating hepatic lipid uptake into cells. Thus, Cmip represents a promising novel target for the prevention and treatment of NAFLD. 5mc 5-methylcytosine.

References

    1. Ahrens M, et al. DNA methylation analysis in nonalcoholic fatty liver disease suggests distinct disease-specific and remodeling signatures after bariatric surgery. Cell Metab. 2013;18:296–302. - PubMed
    1. Danford CJ, Yao ZM, Jiang ZG. Non-alcoholic fatty liver disease: a narrative review of genetics. J. Biomed. Res. 2018;32:389–400. - PMC - PubMed
    1. Gerhard GS, et al. Differentially methylated loci in NAFLD cirrhosis are associated with key signaling pathways. Clin. Epigenetics. 2018;10:93. - PMC - PubMed
    1. Botello-Manilla AE, Chavez-Tapia NC, Uribe M, Nuno-Lambarri N. Genetics and epigenetics purpose in nonalcoholic fatty liver disease. Expert. Rev. Gastroenterol. Hepatol. 2020;14:733–748. - PubMed
    1. Hyun J, Jung Y. DNA methylation in nonalcoholic fatty liver disease. Int. J. Mol. Sci. 2020;21:8138. - PMC - PubMed

Publication types