. 2023 Jan 6;14(1):97.
doi: 10.1038/s41467-022-35778-1.

Dysregulation of PRMT5 in chronic lymphocytic leukemia promotes progression with high risk of Richter's transformation

Affiliations

Dysregulation of PRMT5 in chronic lymphocytic leukemia promotes progression with high risk of Richter's transformation

Zachary A Hing et al. Nat Commun. .

Abstract

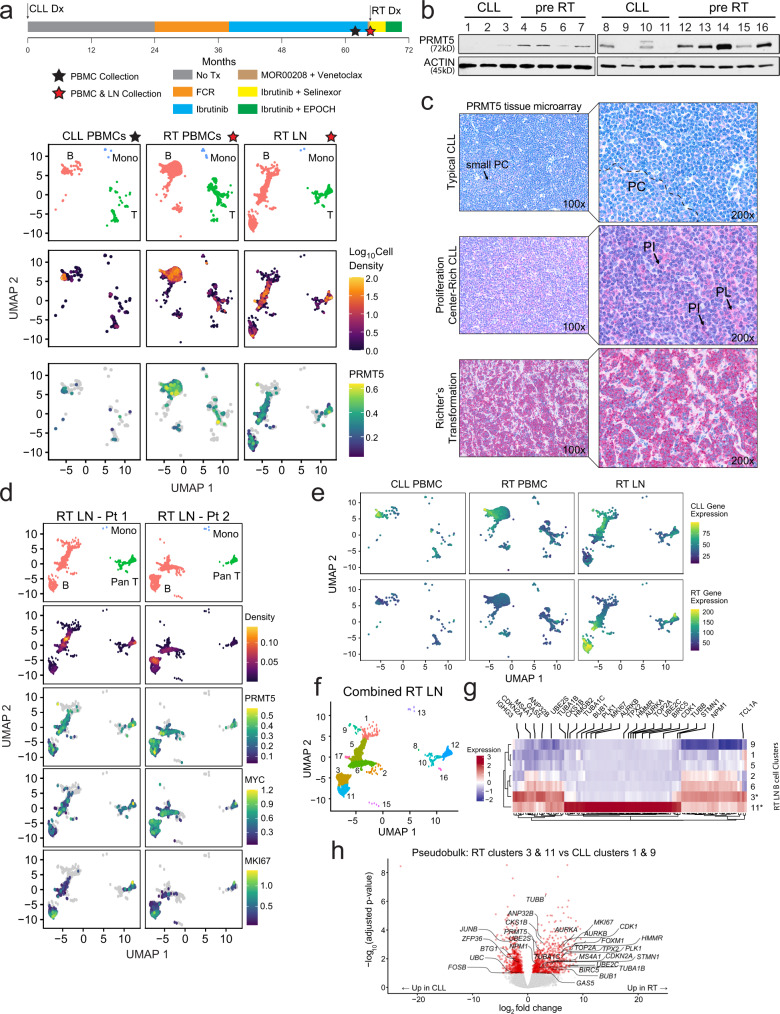
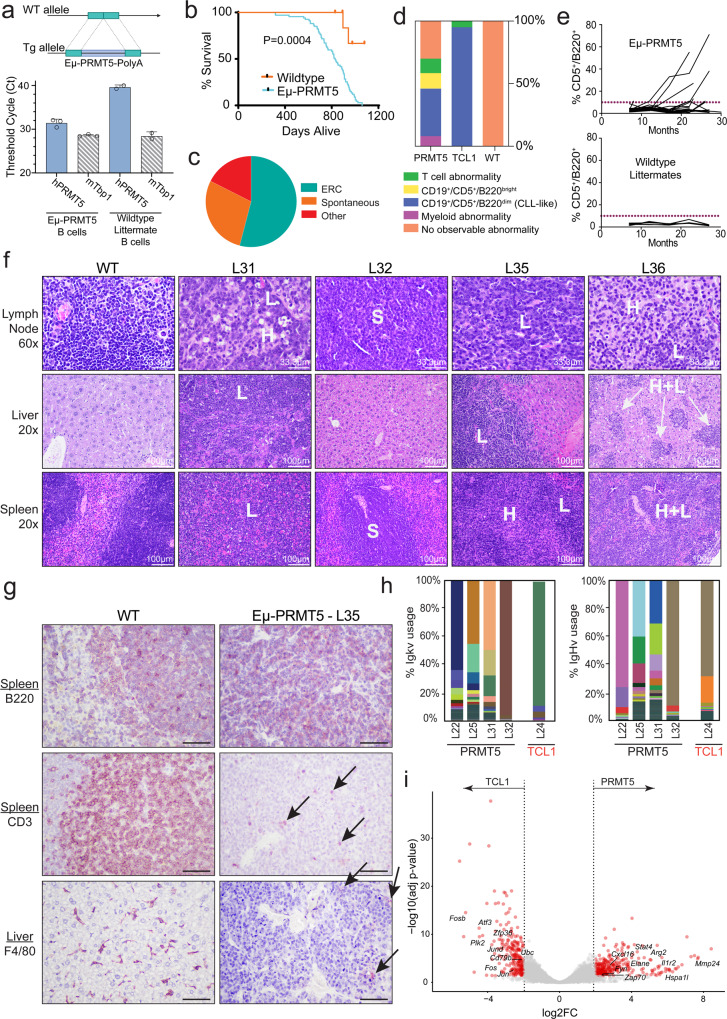
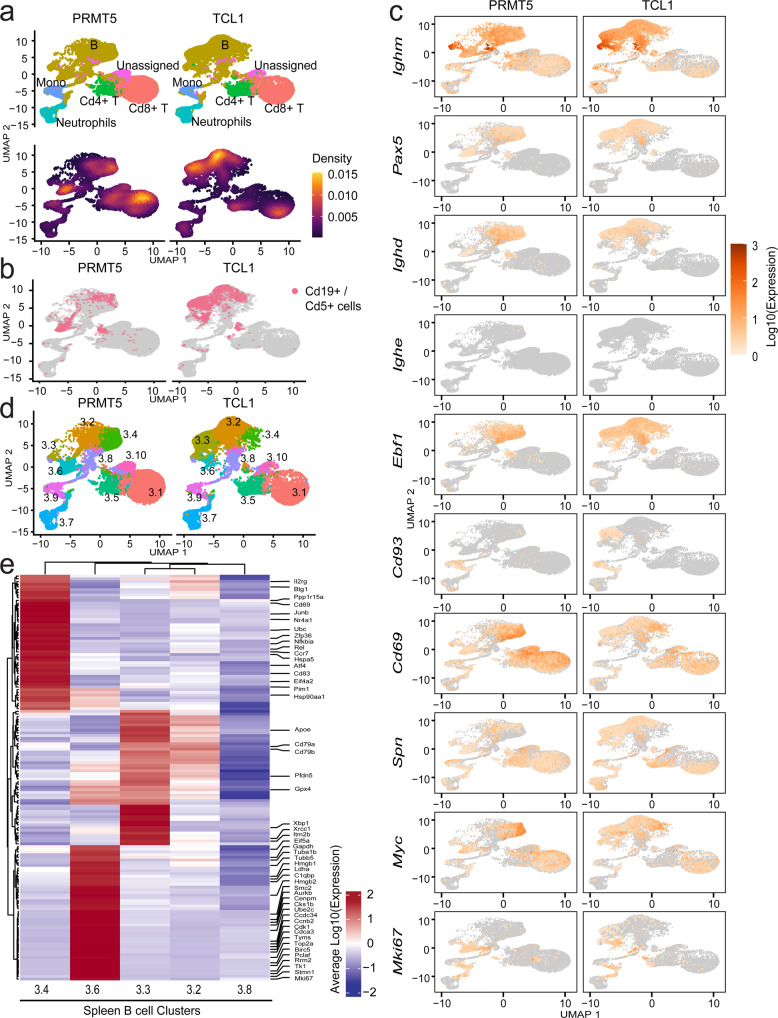
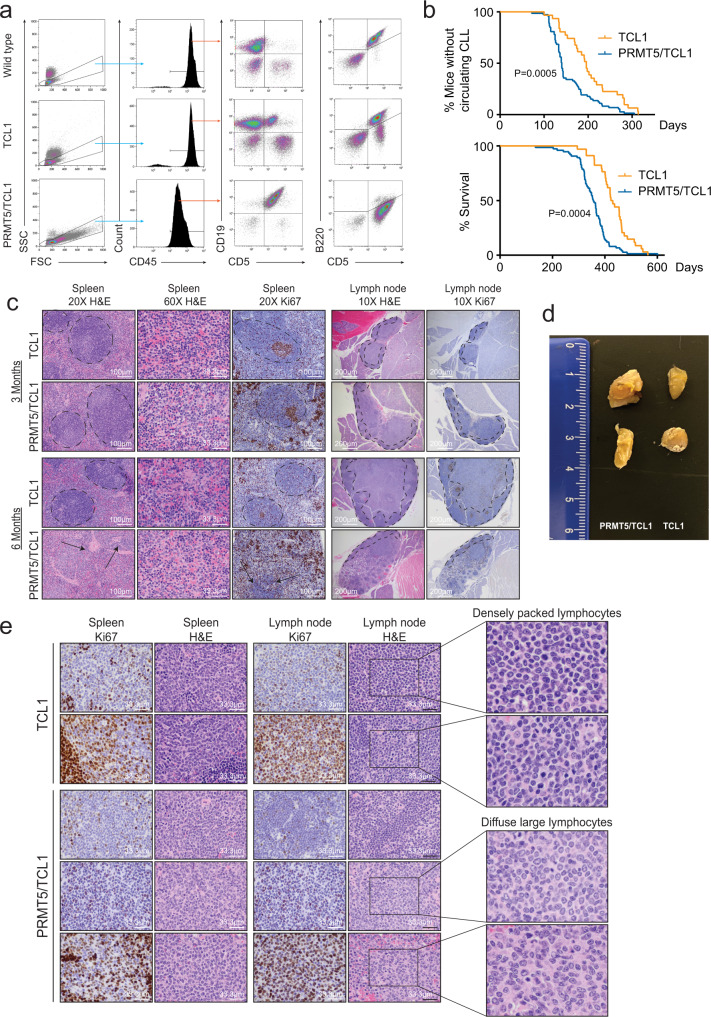
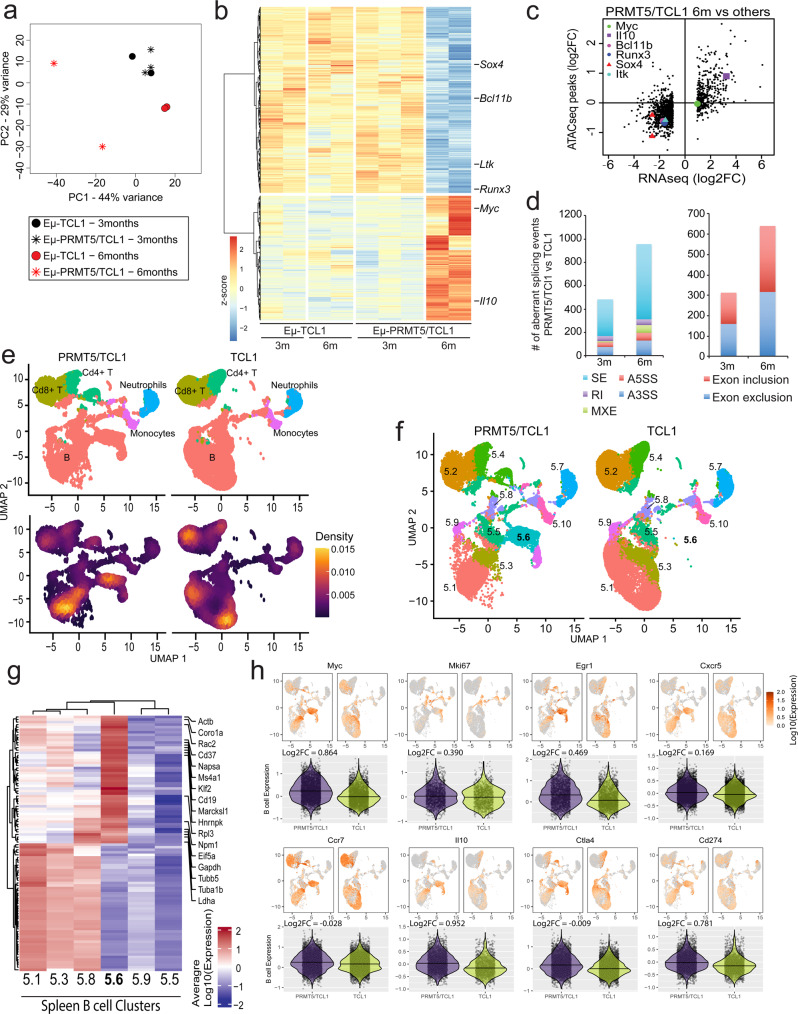
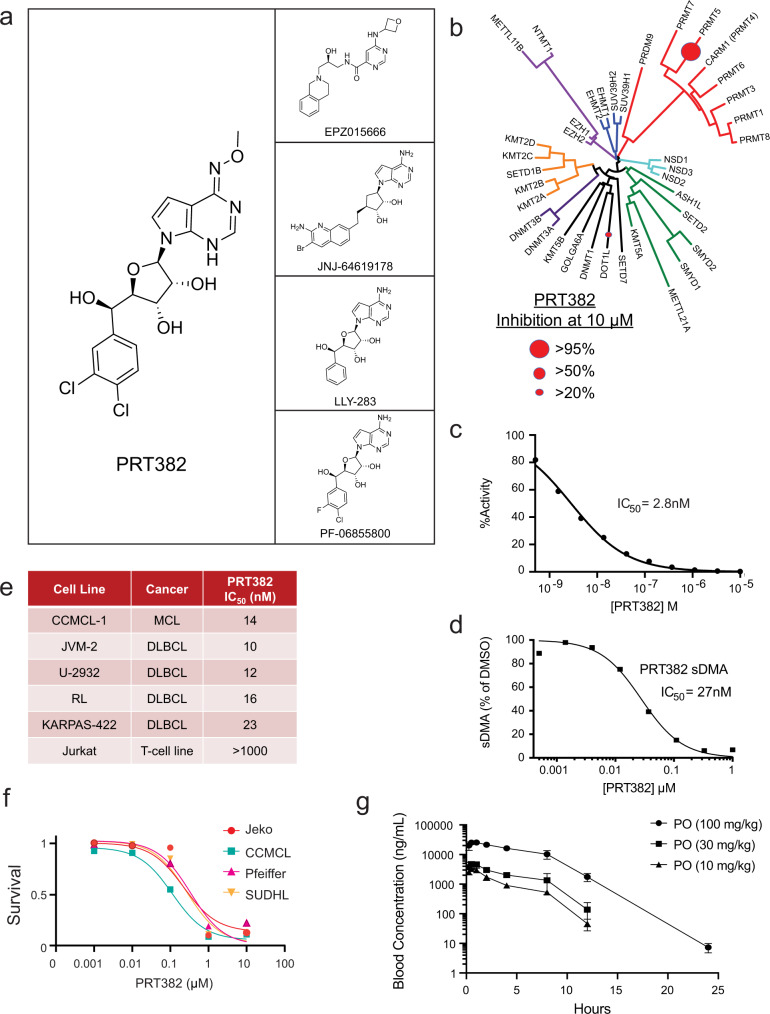
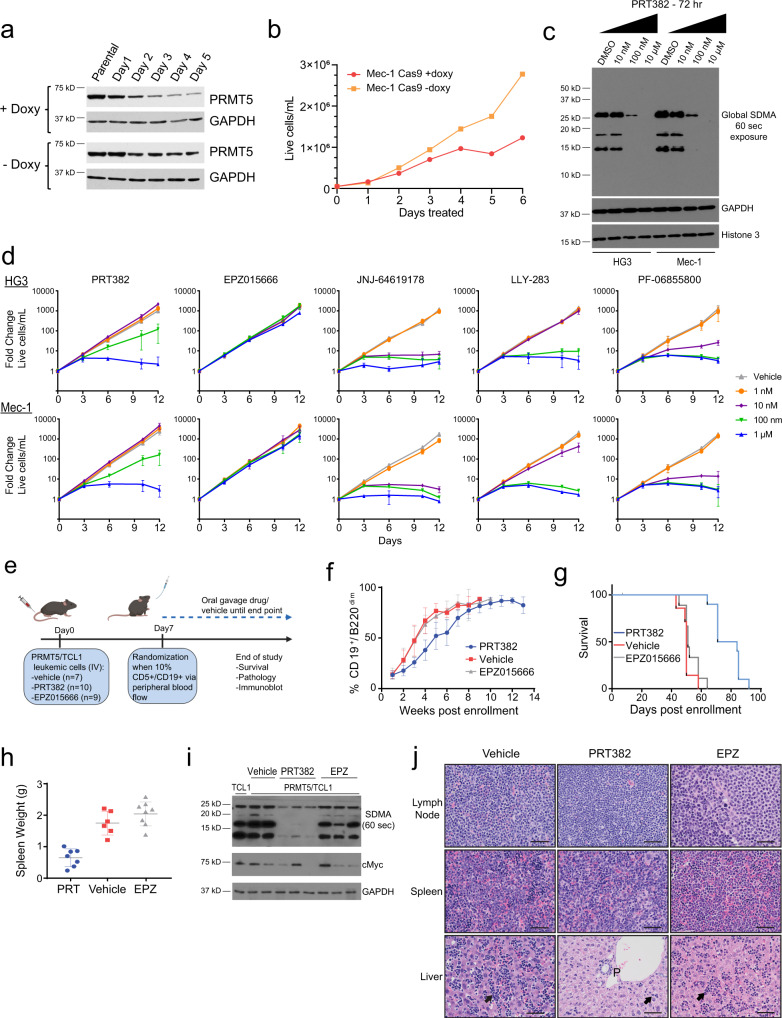
Richter's Transformation (RT) is a poorly understood and fatal progression of chronic lymphocytic leukemia (CLL) manifesting histologically as diffuse large B-cell lymphoma. Protein arginine methyltransferase 5 (PRMT5) is implicated in lymphomagenesis, but its role in CLL or RT progression is unknown. We demonstrate herein that tumors uniformly overexpress PRMT5 in patients with progression to RT. Furthermore, mice with B-specific overexpression of hPRMT5 develop a B-lymphoid expansion with increased risk of death, and Eµ-PRMT5/TCL1 double transgenic mice develop a highly aggressive disease with transformation that histologically resembles RT; where large-scale transcriptional profiling identifies oncogenic pathways mediating PRMT5-driven disease progression. Lastly, we report the development of a SAM-competitive PRMT5 inhibitor, PRT382, with exclusive selectivity and optimal in vitro and in vivo activity compared to available PRMT5 inhibitors. Taken together, the discovery that PRMT5 drives oncogenic pathways promoting RT provides a compelling rationale for clinical investigation of PRMT5 inhibitors such as PRT382 in aggressive CLL/RT cases.


Conflict of interest statement

R.B. has received research funding from Prelude Therapeutics. P.S., M.W., P.P., C.X., and K.V. are employees of Prelude Therapeutics. All the remaining authors declare no competing interests. This does not alter our adherence to Nature Communications policies on sharing data and materials.

Figures

Fig. 1
Fig. 1. PRMT5 is overexpressed in RT and in CLL undergoing RT.
a Patient 1 (Pt 1) timeline. ScRNA-seq UMAP plots stratified by disease/tissue visualizing cell type clusters, local log10(cell density), and PRMT5 expression. Cell density color scale is shown as the Log10-transformed cell count within hexagonal bins. PRMT5 expression is shown as the Log10-transformed expression where expression is size factor normalized UMI counts. b PRMT5 expression in CLL B cells via western blot. Patient samples were collected during the CLL-phase (n = 16) and retrospectively identified as those eventually progressing (pre-RT) or not (CLL) to RT within one year from the time of collection. c Representative PRMT5 staining by tissue microarray in lymph node biopsies from 70 CLL cases (typical distribution of proliferation centers or proliferation center-rich) and 15 RT cases. PL prolymphocytes, PI paraimmunoblasts. d ScRNA-seq of two RT patient tumors collected at the time of RT diagnosis. UMAP plots stratified by RT patient LN biopsy sample visualizing cell type clusters; cell density; and expression of PRMT5, MYC, and MKI67. Cell types were assigned by cell type markers, Supplemental Fig. 1B. Cell density is calculated as the 2d kernel density estimate mapped to color scale. Gene expression is shown as the Log10-transformed expression where expression is size factor normalized UMI counts. e Aggregate gene expression of CLL and RT-specific genes identified from literature (Nadeu et al. 2022, Supplemental Table 11b) in longitudinal samples (Pt 1). Expression is shown as the Log10-transformed size factor normalized UMI counts scaled for each gene module. f RT Pt 1 and Pt 2 nodal cells with Leiden clusters distinguished by color and number. g Heatmap highlighting the top 50 enriched genes in RT-specific nodal B-cell clusters 3 and 11, from Pt 1 and Pt 2 shown in (d, f). Gene expression across 100 genes is shown as the average Log10-transformed expression in nodal B-cell clusters. Genes associated with leukemia and lymphoma are highlighted. h Pseudobulk differential gene expression between RT LN (3 & 11) and CLL (1 & 9) enriched B-cell clusters. Highlighted genes have adjusted P value <0.1 and fold change >1.5. Source data are provided as a Source Data file.
Fig. 2
Fig. 2. Overexpression of PRMT5 induces lymphoid proliferation in vivo.
a Schematic representation of the construct used to generate the Eµ-PRMT5 transgenic mouse. RT-qPCR for hPRMT5 in B cells of Eµ-PRMT5 mice and WT littermates. mTbp1 shown as control. Circles indicate individual mice (n = 3, Eµ-PRMT5 mice; n = 2, WT mice). Bars indicate mean ± SD. b Eµ-PRMT5 mice (n = 67) and WT littermates (n = 10) survival. Eµ-PRMT5 mice median survival = 829 days. Kaplan–Meier plot statistics: Mantel–Cox test [P = 0.0004, hazard ratio = 0.12 95% CI (0.069–0.23)]. c Cause of death (COD) observations for Eµ-PRMT5 transgenic mice (n = 75). Categorical COD was recorded as either spontaneous death or meeting predefined euthanasia criteria. Unresolved cause of death cases were grouped as “other”. d A cohort of Eµ-PRMT5 (n = 26), Eµ-TCL1 (n = 35), and WT littermate mice (n = 9) were assessed monthly for spontaneous disease expansion by flow cytometry of peripheral blood. Expansive populations of T cells (Cd45+/Cd5+), B cells (Cd19+/Cd5+/B220bright), CLL-like cells (Cd19+/Cd5+/B220dim), or myeloid cells (SSChigh & Cd19/Cd5) were observed in varying ratios within groups. e Rate of CLL-like cell accumulation in Eµ-PRMT5 and WT littermate mice (from d). The dotted line indicates 10% Cd5+ /B220+ cells in the blood observed via flow cytometry. f Histopathology analysis via hematoxylin and eosin (H&E) staining of Eµ-PRMT5 (n = 4) mice at ERC and age-matched WT littermate (n = 3). L anaplastic large lymphocytes, H bland histiocytes, S sheets of small lymphocytes. g Representative immunohistochemistry of tumors from Eµ-PRMT5 (n = 5) mice. Arrows indicate scattered CD3+ and F4/80+ cells. This mixture of cell types is consistent with the diagnosis of histiocyte-associated lymphoma, which is the murine counterpart of the human disease T-cell and Histiocyte-rich B-cell lymphoma. B220 and CD3 shown in spleen, F4/80 shown in liver. Images shown at ×40 magnification. Scale bar is 50 µm. h B-cell receptor variable gene usage in splenic CLL-like cells from Eµ-PRMT5 (n = 4) and Eµ-TCL1 (n = 1) mice evaluated via RNA-seq. Colors indicate BCR gene usage. i Bulk RNA-seq in splenic CLL-like cells from Eµ-PRMT5 (from h) and Eµ-TCL1 mice (n = 3). Red highlighted genes have adjusted P value <0.05 and fold change >4. Source data are provided as a Source Data file.
Fig. 3
Fig. 3. PRMT5 promotes a distinct gene expression signature in murine CLL-like cells resembling human RT.
a ScRNA-seq analysis of spleen cells in Eµ-PRMT5 (n = 5) and Eµ-TCL1 (n = 4) mice, visualized via UMAP and clustered according to K-means (n = 10). B cell (Cd19+, Ms4a1+, Cd79a+), T cell (Cd3+, Cd4+, Cd8+), Mono: monocyte (Cd14+, Itgam), and neutrophil (Cd177, Itgam) clusters were assigned as indicated, Supplemental Fig. 2E. Cell density is calculated as the 2d kernel density estimate mapped to color scale. b “CLL-like” cells with co-expression of Cd19 and Cd5 (UMI counts >0) identified in the spleen of both Eµ-PRMT5 and Eµ-TCL1 (mice from a), localized to specific cell clusters. c Relative gene expression of B-cell maturation and leukemogenic markers in the spleen cells of Eµ-PRMT5 and Eµ-TCL1 mice (from a). Gene expression is shown as the Log10-transformed expression where expression is size factor normalized UMI counts. d K-means clusters stratified by genotype. Clusters are distinguished by color and number. e Heatmap highlighting the top 50 cluster-specific genes among B-cell clusters enriched in Eµ-PRMT5 (3.4, 3.6) and Eµ-TCL1 (3.4) mice (from a), showing expression relative to additional B-cell clusters 3.2 and 3.8. Gene expression across 150 genes is shown as the average Log10-transformed expression in splenic B-cell clusters. Genes associated with leukemia and lymphoma are highlighted. Source data are provided as a Source Data file.
Fig. 4
Fig. 4. Overexpression of PRMT5 contributes to the progression of CLL in vivo and results in an aggressive phenotype.
a Eµ-PRMT5/TCL1 (n = 78) and Eµ-TCL1 (n = 36) mice were followed monthly for spontaneous disease expansion by flow cytometry of peripheral blood. Representative flow cytometry plots are shown in 8-month-old mice. CLL-like disease development was determined by the expansion of Cd19+/Cd5+/B220dim cell populations. Gating strategy to visualize single Cd45+ cells as indicated. b Eµ-PRMT5/TCL1 and Eµ-TCL1 mice (from a) were followed monthly and assessed for disease development and survival. CLL-like disease onset (>20% Cd19+ /Cd5+ cells in peripheral blood; top panel) and survival (bottom panel) comparisons were visualized via Kaplan–Meier plot, and statistical analysis was completed using the log-rank (Mantel–Cox) test. Median time to disease onset: 140 days, Eµ-PRMT5/TCL1; 196 days Eµ-TCL1. Median survival: 356 days, Eµ-PRMT5/TCL1; 426 days Eµ-TCL1. Disease onset: P = 0.0005, hazard ratio = 0.5, 95% CI (0.34–0.74); survival: P = 0.0004, hazard ratio = 0.13, 95% CI (0.07–0.23). Source data are provided as a Source Data file. c Representative histopathology analysis via H&E and Ki67 staining analysis of spleen and lymph node tissues from Eµ-TCL1 and Eµ-PRMT5/TCL1 mice at 3 and 6 months of age (Eµ-TCL1: n = 3, n = 2, respectively; Eµ-PRMT5/TCL1: n = 4, n = 4, respectively). Dashed lines encircle proliferative white pulp areas in the spleen, which are absent in 6-month Eµ-PRMT5/TCL1 mice. Splenic lymphoid tissue with marked effacement of normal lymphoid architecture is indicated with arrows. Ki67 staining of splenic and lymph node tissue highlights the germinal centers. Proliferative lymph node germinal centers are also highlighted by dashed lines. d Gross histology examination of cervical lymph nodes collected from Eµ-PRMT5/TCL1 (left) and Eµ-TCL1 (right) mice (n = 2 each). Enlarged lymph nodes were frequently observed in Eµ-PRMT5/TCL1 animals. e Representative histopathology analysis via H&E and Ki67 staining of spleen and lymph node tissues from Eµ-PRMT5/TCL1 (n = 4) and Eµ-TCL1 (n = 2) mice euthanized upon the development of a disease phenotype meeting predefined removal criteria. Scale bars as indicated. Cut out of lymph node H&E images demonstrate transformation to a diffuse large cell phenotype in Eµ-PRMT5/TCL1 mice compared to densely packed lymphocytes in Eµ-TCL1 mice.
Fig. 5
Fig. 5. Leukemogenic signature in Eµ-PRMT5/TCL1 splenic B cells differs from Eµ-TCL1 mice and resembles RT tumors.
a Bulk RNA-sequencing performed on leukemic cells from the spleen of Eµ-TCL1 mice at 3 months (n = 2) and 6 months (n = 2) of age compared with Eµ-PRMT5/TCL1 mice at 3 months (n = 3) and 6 months (n = 2) of age. Variance is visualized via a principal component analysis plot. b DEG analysis from bulk RNA-sequencing in cells from (a) displayed via heatmap. c Comparative gene expression analysis of spleen cells from Eµ-PRMT5/TCL1 mice at 6 months of age compared to all other groups (from a) by log2FC in RNA-seq (x axis) and log2FC in ATAC-seq (y axis). Points represent gene-peak pairs. The plot represents genes exceeding a cutoff of log2 fold change in RNA-seq > |1|. d Differential alternative splicing events between Eμ-PRMT5/TCL1 and Eμ-TCL1 cells (from a) at 3 and 6 months. SE skipped exon, RI retained intron, MXE mutually exclusive exons, A5SS alternative 5’ splice site, A3SS alternative 3’ splice site. e ScRNA-seq analysis of spleen cells in Eµ-PRMT5/TCL1 (n = 4) and Eµ-TCL1 (n = 4) mice, visualized via UMAP and clustered according to K-means (n = 10). B cell (Cd19+, Ms4a1+, Cd79a+), T cell (Cd3+, Cd4+, Cd8+), Mono: monocyte (Cd14+, Itgam), and neutrophil (Cd177, Itgam) clusters were assigned as indicated, Supplemental Fig. 4E. Cell density is calculated as the 2d kernel density estimate mapped to color scale. f K-means clusters stratified by genotype. Clusters are distinguished by color and number. g Heatmap highlighting the top 50 enriched genes in clusters 5.6 and 5.1 in mice (from e), visualizing expression relative to other B-cell clusters. Gene expression across 100 genes is shown as the average Log10-transformed expression in splenic B-cell clusters. Genes associated with leukemia and lymphoma are highlighted. Source data are provided as a Source Data file. h Relative gene expression of CLL and RT-related genes in Eµ-PRMT5/TCL1 and Eµ-TCL1 spleen cells (from e). Violin plots demonstrate the relative distribution of expression in B cells with non-zero expression stratified by genotype and shown as the Log10-transformed expression. Log2-transformed fold changes were calculated from pseudobulk differential expression analysis comparing B-cell expression between models. Points represent individual cells.
Fig. 6
Fig. 6. PRT382, a selective inhibitor of PRMT5.
a Chemical structure of tool compound PRT382, an in vitro and in vivo PRMT5 inhibitor. Structural comparison is shown between recently developed PRMT5 inhibitors EZP015666 (SAM non-competitive) and JNJ-64619178, LLY-283, and PF-06855800 (SAM-competitive). b Selectivity of PRT382 for PRTM5 in contrast to other methyltransferases and PRMT family members. Circle size represents percent inhibition at 10 μM. c Filtration binding assays in the presence of recombinant human PRMT5/MEP50 and histone H2A. Plot is representative of n = 3 experiments. d Reducing sDMA assay in the Granta-519 lymphoma cell line. Plot is representative of N = 3 experiments. e Anti-proliferative activity, measured as IC50, of PTR382 against a leukemia and lymphoma immortalized cell lines. f Dose-dependent proliferation decrease with a panel of B-lymphoma cell lines (n = 3 independent experiments) upon PRMT5 inhibition with increasing doses of PRT382 for 72 h as measured by MTS assay. g PRT382 was formulated in 0.5% carboxymethylcellulose sodium salt + 0.5% Tween80 as a 1 mg/mL suspension for 10 mg/kg and was administered in a 10 mL/kg dose volume by oral gavage to CD-1 mice. Blood was collected at indicated time points and analyzed by LC-MS/MS. In vivo delivery of PRT382 at 10, 30, and 100 mg/kg was well-tolerated in WT CD-1 mice and led to peak plasma levels of 12, 32, and 75 µM, respectively (n = 3 biologically independent animals per group). Blood concentrations are reported as the mean +/−SD. Source data are provided as a Source Data file.
Fig. 7
Fig. 7. Selective targeting of PRMT5 in vitro and in vivo with PRT382 displays antileukemic activity in an aggressive model of CLL/RT.
a Cas9-mediated doxycycline-inducible knockout of PRMT5 in Mec-1 cell line confirmed via western blot (n = 3). b Knockout of PRMT5 in Mec-1 cells (from a) blocked cell proliferation. Plot represents the mean of n = 2 independent experiments. c Global symmetric dimethyl arginine (SDMA) residues via western blot (n = 3) as a marker of PRMT5 activity in HG3 and Mec-1 cell lines treated with PRT382 for 72 h. d Dose-dependent proliferative potential as measured by cell growth in CLL cell lines upon treatment with PRT382 (n = 3), EPZ015666 (n = 4), JNJ-64619178 (n = 2), LLY-283 (n = 2), and PF-06855800 (n = 2). Cell growth is plotted as fold change relative to vehicle-treated cells ±SD. Fresh culture media and PRMT5 inhibitor at indicated concentrations were supplied every 3 days for continuous exposure over 12 days. e Viable Cd19+Cd5+ cells (5 × 106) Eµ-PRMT5/TCL1 spleen cells were engrafted by tail vein into immunocompetent C57/BL6J mice. Engrafted mice were randomly assigned to treatment conditions: PRT382 10 mg/kg (n = 10), EPZ015666 50 mg/kg (n = 9), or vehicle (n = 7) at 1-week post engraftment. All treatments were administered for 4 contiguous days per week. Illustration created with BioRender.com. f Engrafted mice weekly peripheral blood flow cytometry for the percentage of CLL-like (Cd5+Cd19+B220dim) cells ±SD. PRT382 10 mg/kg (n = 10), EPZ015666 50 mg/kg (n = 9), or vehicle (0.5% methylcellulose, 0.1% Tween; n = 7). g Kaplan–Meier plot of engrafted mice survival post-enrollment. Median survival: PRT382, 77 days; EPZ015666, 51 days; vehicle, 50 days. Mantel–Cox test [PRT382 vs vehicle P < 0.0001, hazard ratio = 0.21 95% CI (0.051–0.87); PRT382 vs EPZ015666 P < 0.0001, hazard ratio=0.65 95% CI (0.26–1.6)]. h Average splenic weight at ERC ± SD. PRT382 vs vehicle P = 0.0013; PRT382 vs EPZ015666 P = 0.0004, paired two-tailed t test. PRT382 (n = 7), EPZ015666 (n = 6), vehicle (n = 6). i PRMT5 activity evaluated by immunoblot analysis of splenic B cells from engrafted mice. Vehicle (n = 2), PRT382 (n = 3), or EPZ015666 (n = 3). Cells from Eµ-TCL1 (n = 1) shown as comparison. j Representative H&E histopathology evaluation at ERC in lymph node, spleen, and liver tissues of engrafted mice (from e) treated with vehicle (n = 6), PRT382 (n = 7), or EPZ015666 (n = 8). Sinusoidal lymphocytes are highlighted with arrows. The scale bar is 33.3 µm. Source data are provided as a Source Data file.

References

    1. Maddocks KJ, et al. Etiology of ibrutinib therapy discontinuation and outcomes in patients with chronic lymphocytic leukemia. JAMA Oncol. 2015;1:80–87. - PMC - PubMed
    1. Anderson MA, et al. Clinicopathological features and outcomes of progression of CLL on the BCL2 inhibitor venetoclax. Blood. 2017;129:3362–3370. - PubMed
    1. Rinaldi A, et al. Promoter methylation patterns in Richter syndrome affect stem-cell maintenance and cell cycle regulation and differ from de novo diffuse large B-cell lymphoma. Br. J. Haematol. 2013;163:194–204. - PubMed
    1. Rossi D, et al. Molecular history of Richter syndrome: origin from a cell already present at the time of chronic lymphocytic leukemia diagnosis. Int. J. Cancer J. Int. du cancer. 2012;130:3006–3010. - PubMed
    1. Rossi D, et al. The genetics of Richter syndrome reveals disease heterogeneity and predicts survival after transformation. Blood. 2011;117:3391–3401. - PubMed

Publication types

MeSH terms