. 2023 Jan 17;4(1):100882.
doi: 10.1016/j.xcrm.2022.100882. Epub 2022 Dec 15.

AZD1222-induced nasal antibody responses are shaped by prior SARS-CoV-2 infection and correlate with virologic outcomes in breakthrough infection

Affiliations

AZD1222-induced nasal antibody responses are shaped by prior SARS-CoV-2 infection and correlate with virologic outcomes in breakthrough infection

Anastasia A Aksyuk et al. Cell Rep Med. .

Abstract

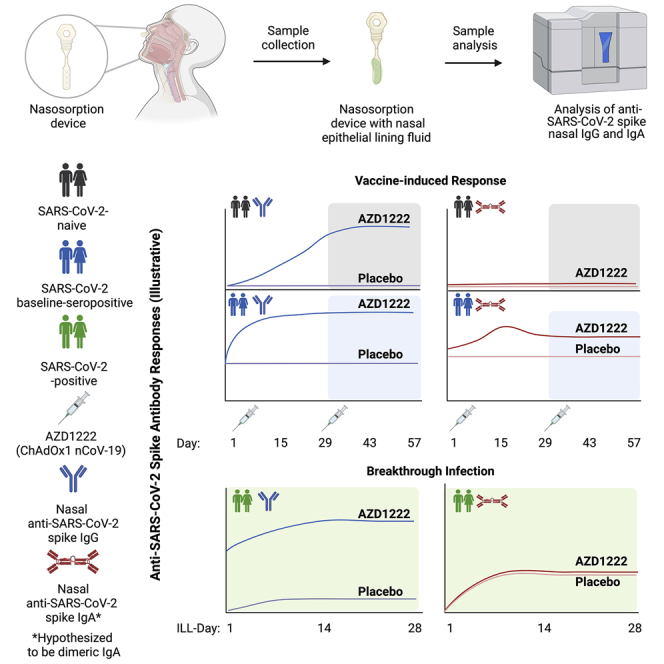
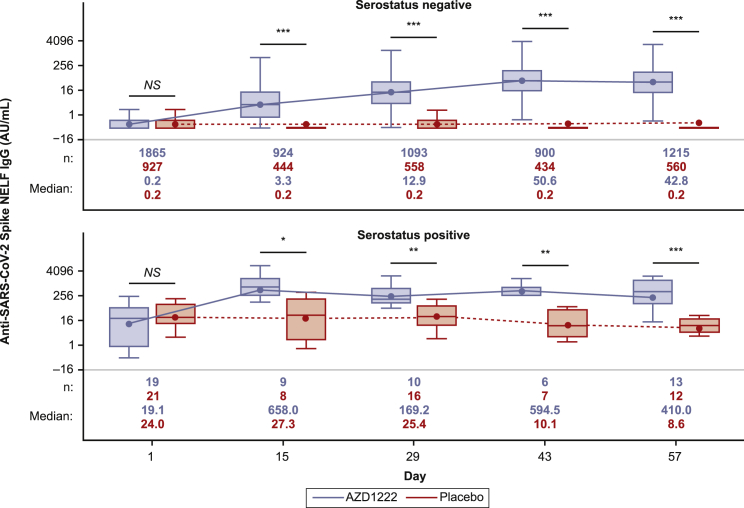
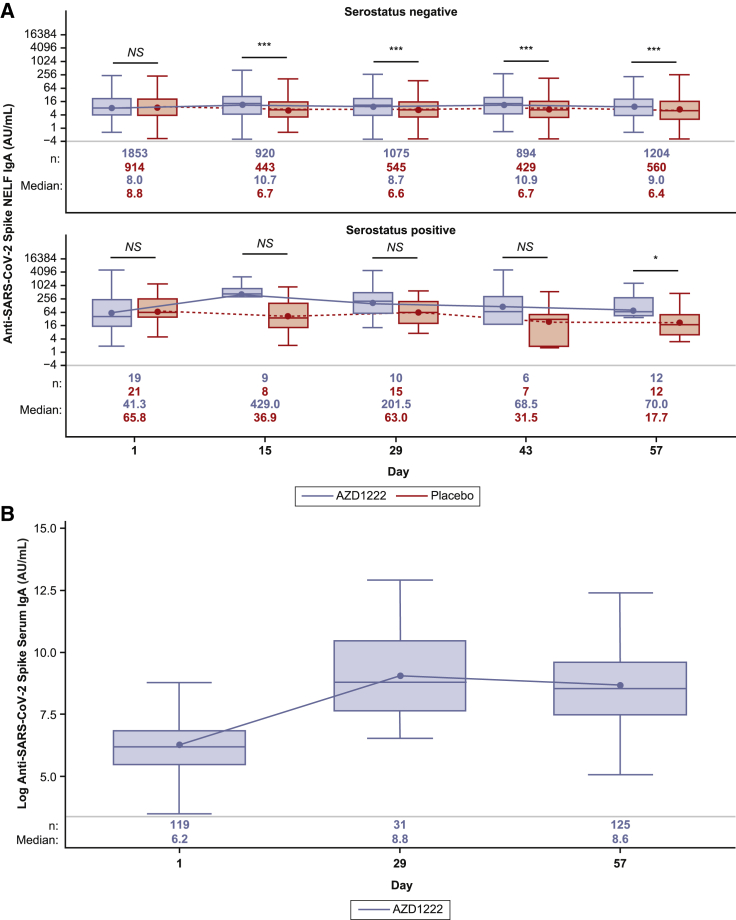
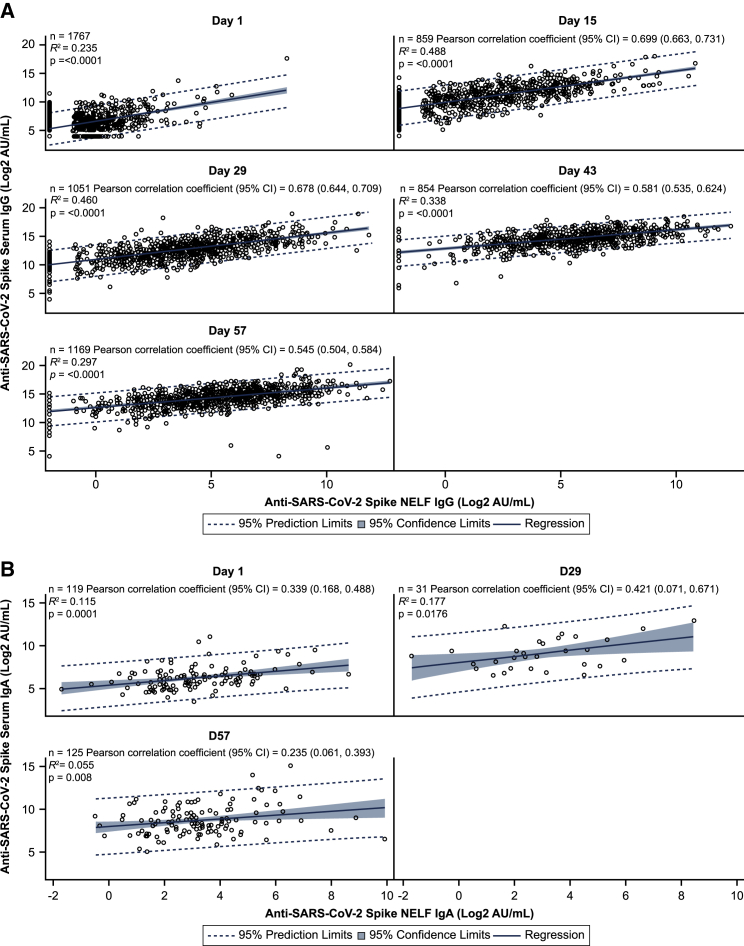
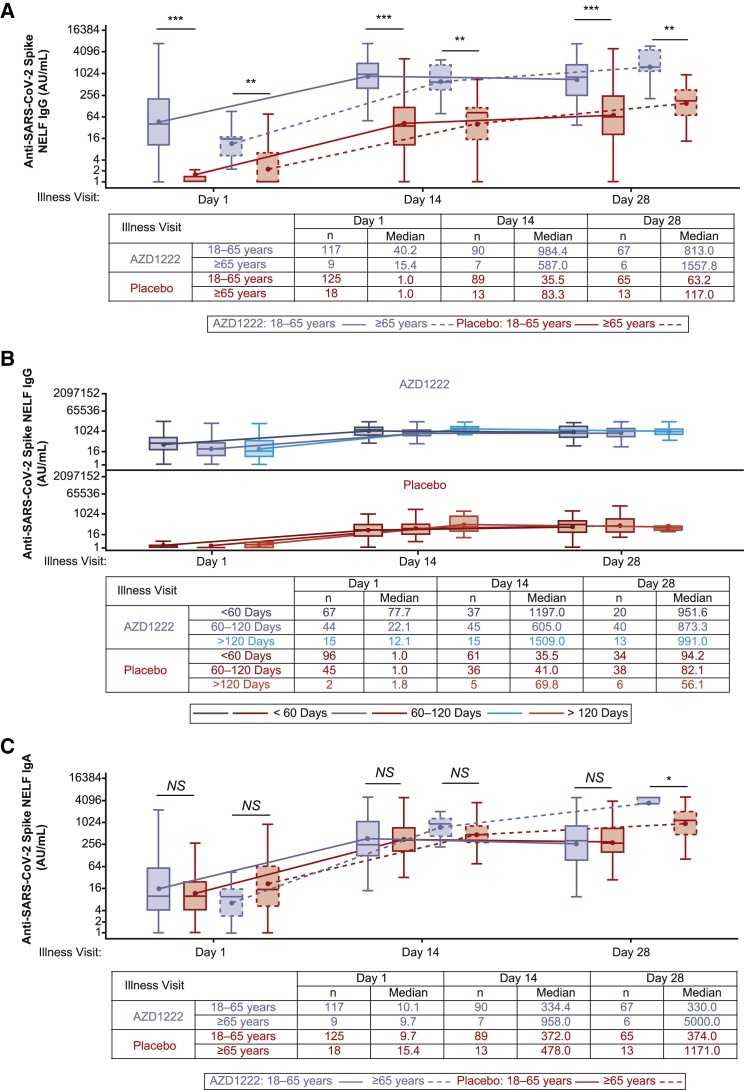
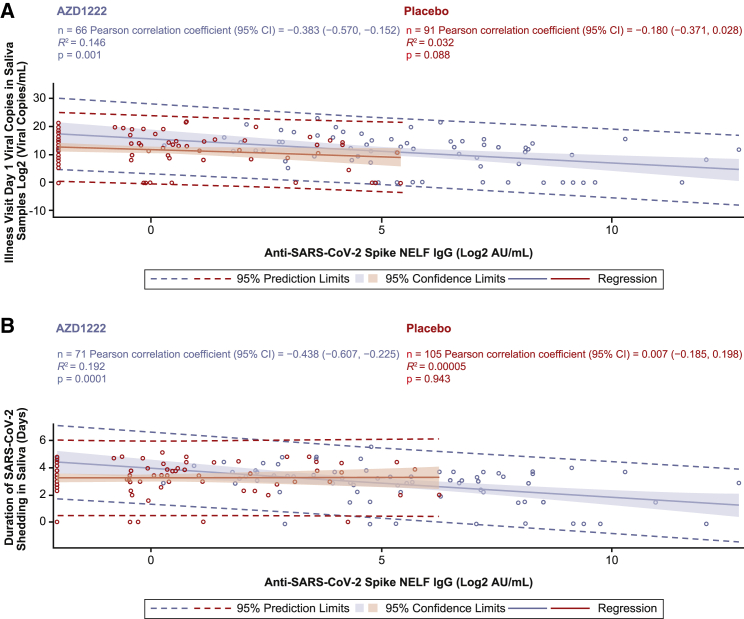
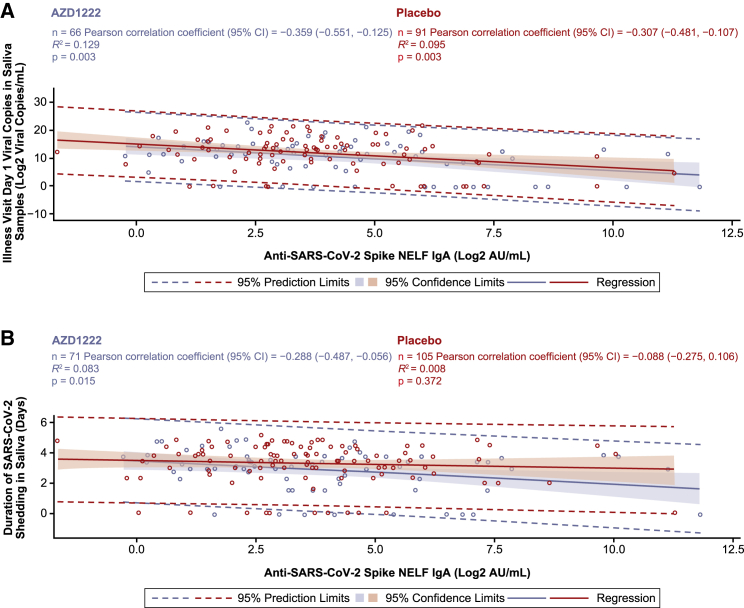
The nasal mucosa is an important initial site of host defense against severe acute respiratory syndrome coronavirus 2 (SARS-CoV-2) infection. However, intramuscularly administered vaccines typically do not achieve high antibody titers in the nasal mucosa. We measure anti-SARS-CoV-2 spike immunoglobulin G (IgG) and IgA in nasal epithelial lining fluid (NELF) following intramuscular vaccination of 3,058 participants from the immunogenicity substudy of a phase 3, double-blind, placebo-controlled study of AZD1222 vaccination (ClinicalTrials.gov: NCT04516746). IgG is detected in NELF collected 14 days following the first AZD1222 vaccination. IgG levels increase with a second vaccination and exceed pre-existing levels in baseline-SARS-CoV-2-seropositive participants. Nasal IgG responses are durable and display strong correlations with serum IgG, suggesting serum-to-NELF transudation. AZD1222 induces short-lived increases to pre-existing nasal IgA levels in baseline-seropositive vaccinees. Vaccinees display a robust recall IgG response upon breakthrough infection, with overall magnitudes unaffected by time between vaccination and illness. Mucosal responses correlate with reduced viral loads and shorter durations of viral shedding in saliva.

Keywords: AZD1222; COVID-19 vaccine; ChAdOx1 nCoV-19; SARS-CoV-2 spike antibodies; breakthrough infection; immunoassay; mucosal immune response; nasal antibody; nasal mucosal immunity; serology.


Conflict of interest statement

Declaration of interests A.A.A., D.W., A.M.S., J.M., and E.J.K. are current employees of AstraZeneca and hold or may hold AstraZeneca stock. H.B. and S. Sanikommui are contractors to AstraZeneca via Bogier Consulting. S. Sproule is a contractor to AstraZeneca via Joule/System One. M.E.S. has received research grants from the Bill and Melinda Gates Foundation, Gilead Sciences, Janssen Global Services, LLC, Merck, and Sanofi Pasteur. Inc. A.R.F. has received institutional grants for research from Pfizer, Merck, Sharpe and Dohme, Janssen, and BioFire Diagnostics and has received fees for serving on the Novavax COVID-19 vaccine Data and Safety Monitoring Board.

Figures

None
Graphical abstract
Figure 1
Figure 1
Quantification of anti-SARS-CoV-2 spike immunoglobulin G (IgG) in nasal epithelial lining fluid (NELF) from immunogenicity substudy participants following AZD1222 vaccination or placebo, by baseline serostatus Boxplots illustrate anti-SARS-CoV-2 spike IgG titers observed in NELF following AZD1222 vaccination or placebo according to participant baseline serostatus. Results are presented according to baseline SARS-CoV-2 serostatus as determined by the presence of SARS-CoV-2 nucleocapsid antibodies. The x axis denotes days since the first AZD1222 or placebo dose. Day 1 and day 29 samples were obtained prior to administration of AZD1222 or placebo. The box denotes interquartile range (IQR), the horizontal line in the box denotes median, and the marker in the box is the geometric mean titer (GMT). Any points more than 1.5 × IQR from the box were considered outliers and are not displayed. The whiskers that extend from the box indicate the minimum and maximum after removing the outliers. Boxplots were created using the log-normal distribution. To provide comprehensive information about the durability of immunogenicity after vaccination, data were censored in AZD1222 study participants at the time of non-study COVID-19 vaccination and for placebo participants at the earlier of the time of non-study COVID-19 vaccination or unblinding, whichever occurred first. Statistical evidence between groups was determined by post hoc two-tailed Mann-Whitney tests. Not significant (NS), p > 0.05; ∗p ≤ 0.05; ∗∗p ≤ 0.01; ∗∗∗p ≤ 0.001. AU/mL, arbitrary units per milliliter.
Figure 2
Figure 2
Quantification of anti-SARS-CoV-2 spike IgA in NELF and serum from immuno-genicity substudy participants following AZD1222 vaccination or placebo (A) Boxplots illustrating anti-SARS-CoV-2 spike IgA titers observed in NELF following AZD1222 vaccination or placebo according to participant baseline SARS-CoV-2 serostatus, as determined by the presence of SARS-CoV-2 nucleocapsid antibodies. To provide comprehensive information about the durability of immunogenicity after vaccination, data were censored in AZD1222 study participants at the time of non-study COVID-19 vaccination and for placebo participants at the earlier of the time of non-study COVID-19 vaccination or unblinding, whichever occurred first. (B) Post hoc analysis of IgA titers observed in serum of baseline-seronegative participants following AZD1222 vaccination. The x axis denotes days since the first AZD1222 or placebo dose. Day 1 and day 29 samples were obtained prior to administration of AZD1222 or placebo. The box denotes IQR, the horizontal line in the box denotes median, and the marker in the box is the GMT. Any points more than 1.5 × IQR from the box were considered outliers and are not displayed. The whiskers that extend from the box indicate the minimum and maximum after removing the outliers. Boxplots were created using the log-normal distribution. Data were censored in participants at the time of non-study COVID-19 vaccination during this post hoc analysis of baseline-seronegative AZD1222 vaccinees. Participants who tested positive for the presence of SARS-CoV-2 nucleocapsid antibodies at any time after day 1 were excluded from this analysis. Statistical evidence between groups was determined by post hoc two-tailed Mann-Whitney tests. NS, p > 0.05; ∗p ≤ 0.05; ∗∗p ≤ 0.01; ∗∗∗p ≤ 0.001.
Figure 3
Figure 3
Analysis of anti-SARS-CoV-2 spike IgG and IgA levels in serum and NELF from immunogenicity substudy participants following AZD1222 vaccination (A) Post hoc correlation analysis depicting the relationship between serum anti-spike IgG levels (y axis) and nasal anti-spike IgG levels (x axis) in baseline-seronegative and baseline-seropositive immunogenicity substudy participants following AZD1222 vaccination. Blue shading denotes 95% confidence limits. A dotted line denotes 95% prediction limits. Clustering of participants along the y axis occurs because of levels of anti-SARS-CoV-2 spike IgG in NELF falling below the assay lower limit of quantification (LLOQ). Dilution-adjusted LLOQ SARS-CoV-2 spike IgG = 0.49 (AU/mL); upper limit of quantification (ULOQ) spike IgG = 7,000 AU/mL. (B) Post hoc correlation analysis depicting the relationship between serum (y axis) and nasal (x axis). IgA samples being compared for each participant are from samples obtained at the same visit. Dilution-adjusted LLOQ SARS-CoV-2 spike IgA = 0.62 (AU/mL); ULOQ spike IgA = 5,000 AU/mL. To provide comprehensive information about durability of immunogenicity after vaccination, data were censored in study participants at the time of receipt of the non-study COVID-19 vaccine, if applicable, but not at the time of unblinding. Participants who tested positive for the presence of SARS-CoV-2 nucleocapsid antibodies at any time after day 1 were excluded from this analysis. CI, confidence interval.
Figure 4
Figure 4
Quantification of anti-SARS-CoV-2 spike IgG and IgA levels in NELF from study participants with symptomatic breakthrough SARS-CoV-2 infection 15 or more days after the second AZD1222 vaccination or placebo (A–C) Boxplots illustrating anti-SARS-CoV-2 spike IgG (A and B) and IgA (C) titers observed in NELF obtained from baseline-seronegative study participants following reverse transcription polymerase chain reaction (RT-PCR)-positive symptomatic breakthrough SARS-CoV-2 infection 15 or more days after the second AZD1222 vaccination or placebo. Results are presented according to study age stratification (i.e., aged 18–65 years and ≥65 years) (A and C) or by time since the second dose primary series AZD1222 or placebo (i.e., <60 days, 60–120 days, and >120 days) (B). The x axis denotes days since the first illness visit for a period of 28 days. The box denotes IQR, the horizontal line in the box denotes median, and the marker in the box is the GMT. Any points more than 1.5 × IQR from the box were considered outliers and are not displayed. The whiskers that extend from the box indicate the minimum and maximum after removing the outliers. Boxplots are created using the log-normal distribution. IgA/G values between 0 and 1 are imputed as 1 to avoid negative log values. Participants who were unblinded or received non-study COVID-19 vaccination or exclusionary medication were excluded from this analysis. NELF sample results received after the database lock are included for samples collected up to the July 30, 2021 data cutoff. Results received after the database lock were not reconciled with the clinical database, and therefore updates to these data may be applied. Statistical evidence between groups was determined by post hoc two-tailed Mann-Whitney tests. NS, p > 0.05; ∗p ≤ 0.05; ∗∗p ≤ 0.01; ∗∗∗p ≤ 0.001.
Figure 5
Figure 5
Analysis of ILL-day 1 anti-SARS-CoV-2 spike IgG levels in NELF versus ILL-day 1 viral load and duration of viral shedding in saliva samples from study participants with symptomatic breakthrough SARS-CoV-2 infection 15 or more days after AZD1222 primary series dose 2 or placebo (A and B) Post hoc correlation analyses depicting the relationship between ILL-day 1 anti-spike IgG levels in NELF (x axes) versus ILL-day 1 viral load in saliva samples (A) and duration of viral shedding in saliva samples (B) obtained from baseline-seronegative study participants with RT-PCR-positive symptomatic breakthrough SARS-CoV-2 infection 15 or more days after the second AZD1222 vaccination or placebo. Shading denotes 95% confidence limits. A dotted line denotes 95% prediction limits. Participants who were unblinded or received a non-study COVID-19 vaccination or exclusionary medication were excluded from this analysis. NELF sample results received after the database lock are included for samples collected up to the July 30, 2021 data cutoff. Results received after the database lock were not reconciled with the clinical database, and therefore updates to these data may be applied.
Figure 6
Figure 6
Analysis of ILL-day 1 anti-SARS-CoV-2 spike IgA levels in NELF versus ILL-day 1 viral load and duration of viral shedding in saliva samples from study participants with symptomatic breakthrough SARS-CoV-2 infection 15 or more days after AZD1222 primary series dose 2 or placebo (A–B) Post-hoc correlation analyses depicting the relationship between ILL-day 1 anti-spike IgA levels in NELF (x axes) versus ILL-day 1 viral load in saliva samples (A) and duration of viral shedding in saliva samples (B) obtained from baseline-seronegative study participants with RT-PCR-positive symptomatic breakthrough SARS-CoV-2 infection 15 or more days after the second AZD1222 vaccination or placebo. Shading denotes 95% confidence limits. A dotted line denotes 95% prediction limits. Participants who were unblinded or received a non-study COVID-19 vaccination or exclusionary medication were excluded from this analysis. NELF sample results received after the database lock are included for samples collected up to the July 30, 2021 data cutoff. Results received after the database lock were not reconciled with the clinical database, and therefore updates to these data may be applied.

References

    1. Lambrecht B.N., Neyt K., van Helden M.J. 4th Edition. Academic Press; 2015. Chapter 94 - The mucosal immune response to respiratory viruses.
    1. Baden L.R., El Sahly H.M., Essink B., Kotloff K., Frey S., Novak R., Diemert D., Spector S.A., Rouphael N., Creech C.B., et al. Efficacy and safety of the mRNA-1273 SARS-CoV-2 vaccine. N. Engl. J. Med. 2021;384:403–416. doi: 10.1056/NEJMoa2035389. - DOI - PMC - PubMed
    1. Falsey A.R., Sobieszczyk M.E., Hirsch I., Sproule S., Robb M.L., Corey L., Neuzil K.M., Hahn W., Hunt J., Mulligan M.J., et al. Phase 3 safety and efficacy of AZD1222 (ChAdOx1 nCoV-19) Covid-19 vaccine. N. Engl. J. Med. 2021;385:2348–2360. doi: 10.1056/NEJMoa2105290. - DOI - PMC - PubMed
    1. Polack F.P., Thomas S.J., Kitchin N., Absalon J., Gurtman A., Lockhart S., Perez J.L., Pérez Marc G., Moreira E.D., Zerbini C., et al. Safety and efficacy of the BNT162b2 mRNA COVID-19 vaccine. N. Engl. J. Med. 2020;383:2603–2615. doi: 10.1056/NEJMoa2034577. - DOI - PMC - PubMed
    1. Voysey M., Clemens S.A.C., Madhi S.A., Weckx L.Y., Folegatti P.M., Aley P.K., Angus B., Baillie V.L., Barnabas S.L., Bhorat Q.E., et al. Safety and efficacy of the ChAdOx1 nCoV-19 vaccine (AZD1222) against SARS-CoV-2: an interim analysis of four randomised controlled trials in Brazil, South Africa, and the UK. Lancet. 2021;397:99–111. doi: 10.1016/S0140-6736(20)32661-1. - DOI - PMC - PubMed

Publication types

Associated data