. 2023 Feb 6;33(3):581-588.e4.
doi: 10.1016/j.cub.2022.12.021. Epub 2023 Jan 6.

Image-dependence of the detectability of optogenetic stimulation in macaque inferotemporal cortex

Affiliations

Image-dependence of the detectability of optogenetic stimulation in macaque inferotemporal cortex

Reza Azadi et al. Curr Biol. .

Abstract

Artificial activation of neurons in early visual areas induces perception of simple visual flashes.1,2 Accordingly, stimulation in high-level visual cortices is expected to induce perception of complex features.3,4 However, results from studies in human patients challenge this expectation. Stimulation rarely induces any detectable visual event, and never a complex one, in human subjects with closed eyes.2 Stimulation of the face-selective cortex in a human patient led to remarkable hallucinations only while the subject was looking at faces.5 In contrast, stimulations of color- and face-selective sites evoke notable hallucinations independent of the object being viewed.6 These anecdotal observations suggest that stimulation of high-level visual cortex can evoke perception of complex visual features, but these effects depend on the availability and content of visual input. In this study, we introduce a novel psychophysical task to systematically investigate characteristics of the perceptual events evoked by optogenetic stimulation of macaque inferior temporal (IT) cortex. We trained macaque monkeys to detect and report optogenetic impulses delivered to their IT cortices7,8,9 while holding fixation on object images. In a series of experiments, we show that detection of cortical stimulation is highly dependent on the choice of images presented to the eyes and it is most difficult when fixating on a blank screen. These findings suggest that optogenetic stimulation of high-level visual cortex results in easily detectable distortions of the concurrent contents of vision.

Keywords: area TE; cortical perturbation; inferior temporal cortex; macaque; optogenetics; perception; vision.


Conflict of interest statement

Declaration of interests The authors declare no competing interests.

Figures
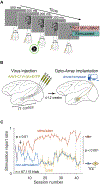
Figure 1.
Figure 1.. Behavioral task, surgical procedure and training phase results
(A) Behavioral task: in each behavioral trial following fixation an image was displayed on the screen for 1 s. In half of the trials, randomly selected, a 200 ms illumination impulse was delivered to IT cortex halfway through image presentation. The animal was rewarded for correctly identifying whether the trial did or did not contain cortical stimulation by looking at one of the two subsequently presented targets at the end of trial. (B) Schematic illustration of the procedure for chronic optogenetic stimulation of IT cortex. Left, injection of AAV5 expressing the excitatory opsin C1V1. Right, Opto-Array implantation: in a separate surgery, we visually confirmed the expression of the excitatory virus and implanted an Opto-Array over the expression zone. We implanted a second array in the corresponding region of the opposite hemisphere where no virus was injected (control site, not shown). (C) Behavioral performance of monkey Ph as a function of session number during the training phase. The y-axis indicates the proportion of the trials reported as stimulated. Red, blue and yellow colors represent data from the stimulation, non-stimulation, and catch trials respectively. Error bars represent bootstrapped 95% confidence intervals. Note that the y-axis does not directly represent performance here, instead the separation between the red and blue lines illustrate the difference between stimulation and nonstimulation trials implying the performance. This difference became significant at session 4 (arrow) and remained so through the training. Fluctuations of performance in time represent usage of different visual stimuli and stimulation intensities throughout the training. No significant difference was found between the catch and non-stimulation trials. The violin plots on the right side illustrate the mean and bootstrapped 95% confidence interval of stimulation report rate for each trial type in the last 3 sessions, between the dashed lines. See also Figure S1
Figure 2.
Figure 2.. Stimulation detection performance is modulated by visual input, cortical location, and illumination power
(A) Left, detection profile: the behavioral performance (d’) on the CPD task for 40 images. The black dots represent d’ for each image and the violin plots represent bootstrapped 95% confidence intervals. Right, permutation test: the blue line indicates the standard deviation of d’s across images, and the red histogram represents results from a permutation test with 10,000 times randomly assigned images on trials revealing the statistical significance of the effect of image on performance. (B) left, correlation between detection profiles within each cortical stimulation site and between them. The violin plots represent 95% confidence intervals of the bootstrapped distribution of the correlations with 10,000 resamples, and the horizontal lines indicate their medians. Right, permutation test: the blue line indicates the observed correlation between the sites. The red histogram represents results from a permutation test with 10,000 times random assignment of stimulation condition over the trials. This shows that the correlation of detection profile patterns between the sites is significantly lower than the null distribution. (C) left, detection performance (d’), as a function of illumination power. Each line represents data from 1 image (5 images in total including the no image condition). Right, permutation test, the standard deviation of the coefficients for each image, derived from fitting of the psychometric curves. The blue line indicates the observed value, and the red distribution represents the null distribution generated by 10,000 times randomly assigning the image indexes to the trials. This confirms the coefficients are significantly different from each other. See also Figures S2 and S3
Figure 3.
Figure 3.. Stimulation detection performance is modulated by image visibility
The x-axis represents 4 levels of image visibility and the gray background, used in experiment 3. The y-axis is the detection performance (d’) on the cortical stimulation detection task. The thin lines represent data from 5 different images and the thick line illustrates the overall averages. Error bars represent 95% confidence intervals. There is a significant correlation between the image visibility and performance (r = 0.7). The p-values for pairwise comparisons are from post-hoc tests of ANOVA (Benjamini-Hochberg corrected). See also Figures S3

Comment in

References

    1. Brindley GS, and Lewin WS (1968). The sensations produced by electrical stimulation of the visual cortex. J. Physiol 196, 479–493. 10.1113/jphysiol.1968.sp008519. - DOI - PMC - PubMed
    1. Murphey DK, Maunsell JHR, Beauchamp MS, and Yoshor D (2009). Perceiving electrical stimulation of identified human visual areas. Proc. Natl. Acad. Sci. U. S. A 106, 5389–5393. 10.1073/pnas.0804998106. - DOI - PMC - PubMed
    1. Gross CG, and De Schonen S (1992). Representation of Visual Stimuli in Inferior Temporal Cortex [and Discussion]. Philos. Trans. R. Soc. Lond. B Biol. Sci 335, 3–10. - PubMed
    1. Kanwisher N, McDermott J, and Chun MM (1997). The fusiform face area: a module in human extrastriate cortex specialized for face perception. J. Neurosci 17, 4302–4311. 10.1523/JNEUROSCI.17-11-04302.1997. - DOI - PMC - PubMed
    1. Parvizi J, Jacques C, Foster BL, Witthoft N, Rangarajan V, Weiner KS, and Grill-Spector K (2012). Electrical stimulation of human fusiform face-selective regions distorts face perception. J. Neurosci 32, 14915–14920. 10.1523/JNEUROSCI.2609-12.2012. - DOI - PMC - PubMed

Publication types

LinkOut - more resources