. 2023 Jan 7;14(1):115.
doi: 10.1038/s41467-022-35624-4.

Early response evaluation by single cell signaling profiling in acute myeloid leukemia

Affiliations

Early response evaluation by single cell signaling profiling in acute myeloid leukemia

Benedicte Sjo Tislevoll et al. Nat Commun. .

Erratum in

  • Author Correction: Early response evaluation by single cell signaling profiling in acute myeloid leukemia.
    Tislevoll BS, Hellesøy M, Fagerholt OHE, Gullaksen SE, Srivastava A, Birkeland E, Kleftogiannis D, Ayuda-Durán P, Piechaczyk L, Tadele DS, Skavland J, Baliakas P, Hovland R, Andresen V, Seternes OM, Tvedt THA, Aghaeepour N, Gavasso S, Porkka K, Jonassen I, Fløisand Y, Enserink J, Blaser N, Gjertsen BT. Tislevoll BS, et al. Nat Commun. 2023 Mar 30;14(1):1767. doi: 10.1038/s41467-023-37488-8. Nat Commun. 2023. PMID: 36997540 Free PMC article. No abstract available.

Abstract

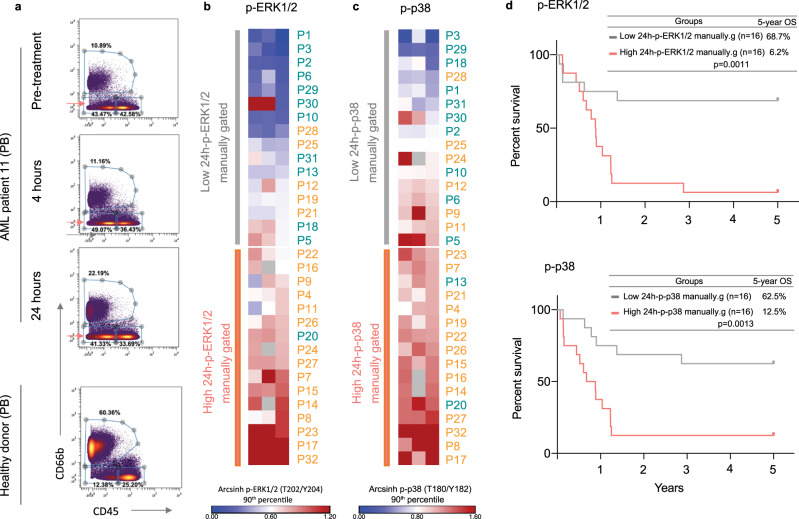
Aberrant pro-survival signaling is a hallmark of cancer cells, but the response to chemotherapy is poorly understood. In this study, we investigate the initial signaling response to standard induction chemotherapy in a cohort of 32 acute myeloid leukemia (AML) patients, using 36-dimensional mass cytometry. Through supervised and unsupervised machine learning approaches, we find that reduction of extracellular-signal-regulated kinase (ERK) 1/2 and p38 mitogen-activated protein kinase (MAPK) phosphorylation in the myeloid cell compartment 24 h post-chemotherapy is a significant predictor of patient 5-year overall survival in this cohort. Validation by RNA sequencing shows induction of MAPK target gene expression in patients with high phospho-ERK1/2 24 h post-chemotherapy, while proteomics confirm an increase of the p38 prime target MAPK activated protein kinase 2 (MAPKAPK2). In this study, we demonstrate that mass cytometry can be a valuable tool for early response evaluation in AML and elucidate the potential of functional signaling analyses in precision oncology diagnostics.


Conflict of interest statement

The authors declare no competing interests.

Figures

Fig. 1
Fig. 1. Mass cytometry analysis of early response evaluation by single-cell signaling to profile.
a Peripheral blood samples were collected from 32 AML patients treated with conventional induction therapy (“7 + 3” cytarabine + daunorubicin). Samples were collected before the start of treatment, at 4- and 24-h after the start of treatment, and immediately fixed to preserve in vivo signaling. Ten patients in this study received per-oral treatment of lenalidomide in addition to the 7 + 3 induction therapy from days 1–21. b Five-year survival Kaplan–Meier curves showing the survival for the 32 AML patients in this study based on conventional therapy response assessment and European Leukemia Net (ELN) 2017 risk classification. Conventional therapy response assessment was done by bone marrow aspiration on day 17 post-treatment or before cycle two of induction therapy. Seventeen patients had CR/CRi, nine patients had nonCR and six patients were aplastic before the second cycle of induction therapy. Based on the ELN 2017 Risk classification, 11 patients had favorable risk, nine had intermediate risk and 12 had adverse risk. c Early therapy response assessment by mass cytometry at 4- and 24-h post-treatment by investigation of intracellular signaling response to chemotherapy. Machine learning approaches were used to identify markers in the blast cell population that could be predictive of patients' 5-year survival hours after the start of induction therapy (Kaplan–Meier curve, 16 patients in each group). Source data are provided as a Source Data file.
Fig. 2
Fig. 2. Characterization of immunophenotype in 32 AML patients by FlowSOM.
a t-SNE maps of the 10 FlowSOM identified metaclusters based on surface marker expression across the seven healthy donors and the 32 AML patients at pre-treatment, 4, and 24 h (20,000 cells per plot for visualization). t-SNE maps are annotated with color-coded overlay shown in (c). b Stacked bar chart showing the metacluster relative distribution in each patient and healthy donor, as a percent of the total population in the pre-treatment sample. Patient numbers are colored by patient 5-year survival (blue = alive, orange = deceased, BM = bone marrow, PB = peripheral blood). The ten patients who received lenalidomide treatment in addition to standard induction chemotherapy (“3 + 7”) are annotated by stars. c Heatmap showing the median marker intensity of the 19 surface markers used for clustering in the pre-treatment sample of the 32 AML patients. The total metacluster size among the 32 AML patients is shown as a percent of the total. Source data are provided as a Source Data file.
Fig. 3
Fig. 3. p-ERK1/2 signaling at 24 h after the start of induction therapy predicts patient 2- and 5-year survival.
a t-SNE plot highlighting the position and distribution of metacluster (MC) 9 (red) in the t-SNE plot of all 32 patients at pre-treatment. The other metaclusters are shown in gray. b Heatmap of the arcsinh transformed 90th percentile p-ERK1/2 in MC9 at all timepoints sorted by the 24 h value, divided by median into high and low 24 h-p-ERK1/2 groups. Patient numbers are color coded by 5-year survival (blue = alive, orange = deceased). Complete remission (CR) by bone marrow aspiration at day 17 or before cycle two of induction therapy, European Leukemia Net (ELN) 2017 risk classification, transplantation status, and minimal residual disease (MRD) status after cycle 2 are shown in color-coded bars to the right. c LASSO Cox regression analysis identified p-ERK1/2 at 24 h in MC 9, as significantly associated with patient 2 and 5-year survival. The 32 AML patients were divided into two groups based on the 24 h median value as shown in (b); high and low 24 h-p-ERK1/2 groups, with 16 patients in each group. Kaplan–Meier survival curve of the 5-year overall survival (OS) in the two groups (Log-rank (Mantel–Cox) test p = 0.0015, hazard ratio (log-rank) low/high group 0.2307 and 95% CI of ratio 0.0945 to 0.5625) show the poor survival of the high group. d Line-graph of the arcsinh transformed 90th percentile p-ERK1/2 value at all timepoints in the two groups. Abbreviations Allo allogenous stem cell transplantation, Auto autologous stem cell transplantation, CRi complete remission with incomplete count recovery, nonCR >5% remaining blast in the bone marrow after the first cycle of induction therapy. Source data are provided as a Source Data file.
Fig. 4
Fig. 4. Validation by manual blast gating confirm p-ERK1/2 and p-p38 prediction of survival.
Manual gating of mass cytometry data was performed by bi-axial gating in cytobank on all 32 patients. a Bi-axial gating strategy of patient P11 (PB peripheral blood) and a healthy donor (PB) for gating guidance. AML blast cells were defined as CD66 low and CD45 low, the red arrows pinpoint the exported population. Raw 90th percentile data of p-ERK1/2 and p-p38 from the CD66low, CD45low cell population was exported from cytobank and arcsinh transformed with cofactor 5. b Heatmap shows the arcsinh transformed 90th percentile data for p-ERK 1/2 and c p-p38, sorted by their respective 24 h values. Patient numbers are color-coded by 5-year survival (blue = alive, orange = deceased). d Kaplan–Meier survival curves (n = 32) in 24 h-low and high-pERK1/2 group (n = 16) and 24 h-low and high-pp38 group (n = 16).Groups are defined by the median 24 h value for each marker. Curve comparison p-values are calculated by Log–rank (Mantel–Cox) test (p-ERK1/2; HR low/high group: 0.2252, 95% CI of ratio: 0.09215–0.5502, p-p38; HR low/high group: 0.2437, 95% CI of ratio: 0.09791–0.6064). Source data are provided as a Source Data file.
Fig. 5
Fig. 5. RNA sequencing shows AP-1 complex induction after the start of induction chemotherapy.
a Venn diagram showing that 525 p-ERK1/2 and p-p38 induced genes were identified among our RNAseq data. These genes were used for further RNA sequencing data analysis. b Heatmap of 90th percentile arcsinh transformed p-ERK1/2 mass cytometry data in M9. The high and low groups used for RNAseq data analysis were defined by the 24 hp-ERK1/2 median value in MC9. Patient numbers are color-coded by 5-year survival (blue = alive, orange = deceased). An overview of the patient sample material and the analysis performed is shown to the right. All 32 patients in the study were analyzed by mass cytometry, 15 patients with mass cytometry and proteomics, and 14 patients with mass cytometry, proteomics, and RNAseq. In addition, diagnostic fresh bone marrow or peripheral blood samples from 18 of the 32 patients was screened with an ex vivo drug sensitivity screen and a selective drug sensitivity score (sDSS). was calculated c Hierarchical clustering (Euclidean distance) of the 10 patients with post-treatment samples, based on the gene expression (DESeq normalized counts) of the 62 differentially expressed genes post-treatment identified between the 24 h-p-ERK1/2 high and low groups (only genes with p-values < 0.05 are shown, exact p-values are shown in the source data, two-sided students t-test). The p-values were not adjusted for multiple comparison testing. The heatmap shows z-scored DESeq2 normalized counts. The two timepoints post-chemotherapy (4 and 24 h) for each patient were considered post-treatment replicates. Mutations identified by NGS and diagnostic cytogenetics are shown for each patient in the top panel. d Line plots of particularly relevant genes showing the DESeq2 normalized counts at the three different timepoints for each patient. Each line represents one patient, and numbers for identification are annotated next to the lines. For patients with only pre-treatment samples, the patient number is annotated to the left. Patients in the 24 h p-ERK1/2 low group are colored in gray, and patients in the 24 h p-ERK1/2 high group are in red. Source data are provided as a Source Data file.
Fig. 6
Fig. 6. Proteomics reveals increased MAPKAPK2 (MK2) expression at 24 h in patients with high p-ERK1/2 signaling.
a Heatmap of the 90th percentile arcsinh transformed p-ERK1/2 in M9 mass cytometry data. The high and low groups used for proteomics data analysis were defined by the 24-h pERK1/2 median value in MC9. Patient numbers are color-coded by 5-year survival (blue = alive, orange = deceased). An overview of the patient sample material and the analysis performed is shown to the right (sDSS = selective drug sensitivity score). Groups for proteomics paired data analysis are highlighted in red. b Hierarchical clustering (Euclidean distance) of the 53 most differentially expressed proteins (Stable isotope labeling using amino acids in cell culture (SILAC) log2 ratio, z-score) identified by a two-sided paired students t-test (only proteins with p-values < 0.01 are shown) between the pre-treatment sample (0 h) and 24-h sample of the seven patients in 24 h p-ERK1/2 high group with 24-h samples. Patients are sorted by sampling timepoint; 0 h and 24-h. Exact p-values for each protein are shown in the source data. Adjustments for multiple comparisons were not used when identifying these genes. c, d The two proteins (MK2 and FTL) among the 15 most significant differentially expressed proteins in the high group (n = 7) that had the most significant increase in expression from pre-treatment to 24 h, compared to the five patients in 24 h p-ERK1/2 low group. c SILAC log2 (Light/Heavy) ratio of MK2 and FTL in all patients analyzed by proteomics (n = 15). Patients in the low group are colored in gray and patients in the high group are colored in red. d The change in protein expression (SILAC log2 ratio) of MK2 and FTL from pre-treatment to 24 h was calculated and compared between the 24 h p-ERK1/2 low and high groups. Patients in the high group had a significantly higher increase in MK2 and FTL compared to the low group (unpaired t-test, with two-tailed p-value 0.0091 for MK2 and 0.0026 for FTL). Source data are provided as a Source Data file.
Fig. 7
Fig. 7. Drug sensitivity and resistance testing (DSRT).
a Heatmap of the 90th percentile arcsinh transformed p-ERK1/2 in M9 mass cytometry data. The high and low groups were defined by the 24-h p-ERK1/2 median value. Patient numbers are color-coded by 5-year survival (blue = alive, orange = deceased). Remission at day 17 post-treatment or before cycle two is annotated to the right. The blue circles indicate the 18 patients that were analyzed by ex vivo drug sensitivity screening. Diagnostic cytogenetics of inv(16), del(7q), FLT3-ITD, and mutations detected by NGS are shown to the right. The column FLT3-ITD annotates the diagnostic cytogenetics, the column FLT3 NGS shows FLT3 mutations detected by NGS (TruSight myeloid panel). Mutations are grouped by gene function, colors are shown in the top panel, and color code is shown to the upper right. Gray squares annotate detected mutations, and white squares if the mutation was not detected. b,c The 10 drugs with the highest selective drug sensitivity score (sDSS) for each patient were selected and the 12 most common drug targets in the cohort are shown for the 24h-pERK1/2 low and high group. The circle maps below the x-axis shown which patient had each target among its top 10 drugs. MEK inhibitors are annotated in yellow. b Top targets among patients in the low group. c Top targets among patients in the high group. Abbreviations CR complete remission, CRi complete remission with incomplete count recovery, nonCR = >5% remaining blast in the bone marrow after the first cycle of induction therapy. Source data are provided as a Source Data file.

References

    1. Arber DA, et al. The 2016 revision to the World Health Organization classification of myeloid neoplasms and acute leukemia. Blood. 2016;127:2391–2405. doi: 10.1182/blood-2016-03-643544. - DOI - PubMed
    1. Dohner H, et al. Diagnosis and management of AML in adults: 2017 ELN recommendations from an international expert panel. Blood. 2017;129:424–447. doi: 10.1182/blood-2016-08-733196. - DOI - PMC - PubMed
    1. Bullinger L, Döhner K, Döhner H. Genomics of acute myeloid leukemia diagnosis and pathways. J. Clin. Oncol. 2017;35:934–946. doi: 10.1200/JCO.2016.71.2208. - DOI - PubMed
    1. Kurtz DM, et al. Dynamic risk profiling using serial tumor biomarkers for personalized outcome prediction. Cell. 2019;178:699–713.e619. doi: 10.1016/j.cell.2019.06.011. - DOI - PMC - PubMed
    1. Han EJ, Lee BH, Kim JA, Park YH, Choi WH. Early assessment of response to induction therapy in acute myeloid leukemia using (18)F-FLT PET/CT. EJNMMI Res. 2017;7:75. doi: 10.1186/s13550-017-0326-8. - DOI - PMC - PubMed

Publication types

MeSH terms

Substances