. 2023 Jan 7;21(1):6.
doi: 10.1186/s12967-022-03868-9.

Splicing factor-mediated regulation patterns reveals biological characteristics and aid in predicting prognosis in acute myeloid leukemia

Affiliations

Splicing factor-mediated regulation patterns reveals biological characteristics and aid in predicting prognosis in acute myeloid leukemia

Fang-Min Zhong et al. J Transl Med. .

Abstract

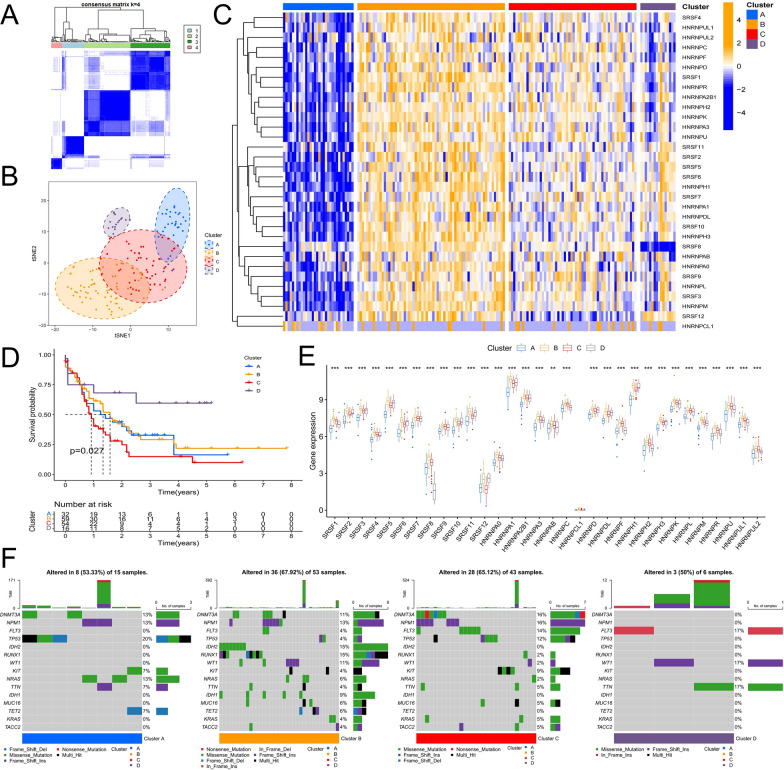
Background: Alternative splicing (AS) of RNA is a fundamental biological process that shapes protein diversity. Many non-characteristic AS events are involved in the onset and development of acute myeloid leukemia (AML). Abnormal alterations in splicing factors (SFs), which regulate the onset of AS events, affect the process of splicing regulation. Hence, it is important to explore the relationship between SFs and the clinical features and biological processes of patients with AML.

Methods: This study focused on SFs of the classical heterogeneous nuclear ribonucleoprotein (hnRNP) family and arginine and serine/arginine-rich (SR) splicing factor family. We explored the relationship between the regulation patterns associated with the expression of SFs and clinicopathological factors and biological behaviors of AML based on a multi-omics approach. The biological functions of SRSF10 in AML were further analyzed using clinical samples and in vitro experiments.

Results: Most SFs were upregulated in AML samples and were associated with poor prognosis. The four splicing regulation patterns were characterized by differences in immune function, tumor mutation, signaling pathway activity, prognosis, and predicted response to chemotherapy and immunotherapy. A risk score model was constructed and validated as an independent prognostic factor for AML. Overall survival was significantly shorter in the high-risk score group. In addition, we confirmed that SRSF10 expression was significantly up-regulated in clinical samples of AML, and knockdown of SRSF10 inhibited the proliferation of AML cells and promoted apoptosis and G1 phase arrest during the cell cycle.

Conclusion: The analysis of splicing regulation patterns can help us better understand the differences in the tumor microenvironment of patients with AML and guide clinical decision-making and prognosis prediction. SRSF10 can be a potential therapeutic target and biomarker for AML.

Keywords: Alternative splicing; Prognosis; SRSF10; Splicing factor; Tumor microenvironment.


Conflict of interest statement

The authors state no conflict of interest.

Figures

Fig. 1
Fig. 1
Genetic characteristics of SFs in hnRNP and SR families in AML samples. A The heatmap depicts the difference in SFs expression between AML samples and normal samples. B Somatic mutations in SFs in 134 TCGA-LAML patient samples; Each column in the waterfall plot represents the mutation type for each patient, the tumor mutation burden (TMB) for each patient is shown in the top half, the mutation frequency and mutation type ratio of SFs are shown on the right, and the proportion of different base transitions is shown below. C Copy number variation frequency of SFs. D The position of SFs on 23 chromosomes (*P < 0.05; **P < 0.01; ***P < 0.001)
Fig. 2
Fig. 2
Identification of SFs related regulatory patterns. A AML patients were divided into four clusters by consistent clustering algorithm. B t-SNE algorithm verifies the clustering ability based on SFs expression. C The heatmap shows the expression of SFs in the four clusters. D Survival analysis of patients with different clusters. E Expression differences of SFs in the four clusters. F Differences in somatic mutations among the four clusters (*P < 0.05; **P < 0.01; ***P < 0.001)
Fig. 3
Fig. 3
Differences in signaling pathways between different splicing regulation patterns. A Difference in enrichment scores of KEGG gene sets related to cancer development in Cluster A and Cluster B, Cluster C and Cluster D. B Difference in enrichment scores of cancer-related hallmark gene sets related to cancer development in Cluster A and Cluster B, Cluster C and Cluster D. C The Veen diagram shows the intersection of the difference AS events between pairs of comparison in the four clusters. D Overlapping AS events after differential expression between cluster A and other clusters. E The Upset plot displays the type and number of AS events. F Functional analysis of AS event genes
Fig. 4
Fig. 4
Differences in immune-related features and prediction of treatment sensitivity among different splicing regulation patterns. A Differences in infiltration of 22 immune cells among the four clusters. B Differences in immune function activity scores among the four clusters. C Differences in immune checkpoint expression among the four clusters. G, H IC50 prediction of the four clusters for cytarabine, doxorubicin, and midostaurin treatment. I Prediction of response to anti-PD-1 and anti-CTAL4 immunotherapy by different splicing regulation patterns (*P < 0.05; **P < 0.01; ***P < 0.001)
Fig. 5
Fig. 5
Construction of risk scoring model. A Identification of DEGs with different splicing regulation patterns. B Identification of DEGs significantly associated with prognosis by Cox regression analysis. C Calculate log(λ) of the minimum tenfold cross-validation error point and determine the corresponding model gene. D Determine the coefficients of model genes. E Survival analysis between high-risk score and low-risk score subgroups. F Time-dependent ROC curve analysis of risk score. G Univariate Cox regression analysis of clinicopathological factors and risk score. H Multivariate Cox regression analysis of clinicopathological factors and risk score. I Alluvial diagram showing the changes of splicing regulation patterns, risk score groups, survival status groups. J Differences in risk scores among different splicing regulation patterns and survival status groups
Fig. 6
Fig. 6
Validation of risk score model and construction of nomogram. AD Survival analysis between the high- and low-risk score groups in the Validation cohorts. A GSE14468; B GSE37642-GPL96; C GSE37642-GPL570; D GSE71014. Log-rank test. EH Time-dependent ROC curve analysis of the risk score in the Validation cohorts. E GSE14468; F GSE37642-GPL96; G GSE37642-GPL570; GSE71014. I Nomogram to predict OS in AML patients. J Time-dependent calibration curve to validate the predictive power of the nomogram. K ROC curve analysis of nomogram and other prognostic factors
Fig. 7
Fig. 7
Expression characteristics of SRSF10 in AML and its relationship with malignant phenotypes of AML cells. A Differences in mRNA expression of SRSF10 between TCGA-LAML samples and GTEx normal blood samples. B Differences in mRNA expression of SRSF10 between 34 cancer samples and normal control samples in GDC database and GTEx database, with AML in yellow. C Differences in mRNA expression of SRSF10 between bone marrow (BM) samples from 4 AML patients and peripheral blood (PB) samples from 8 healthy controls. D Differences in mRNA expression of SRSF10 in peripheral blood samples from 22 AML patients and 23 healthy controls. E, F mRNA and protein expression levels of SRSFF10 in THP-1 cells in SRSF10 overexpression group (SRSF10-oe) and Control group (Control-oeSRSF10), and two knockdown groups (SRSF10-SH1, SRSF10-SH2) and Control group (Control-shSRSF10). G Absorbance at 450 nm wavelength after CCK8 treatment in different SRSF10 treatment groups at different time nodes. The more absorbance increased, the more cell proliferation. H EdU staining was performed on different SRSF10 treatment groups. Top to bottom were all cells in the field of view, S-phase proliferating cells, and the composite of the above two images. The more pink cells, the more proliferating cells. I The ratio of cells in proliferative phase to all cells in a single field observed by fluorescence microscopy after EdU staining in different SRSF10 treatment groups. The larger the ratio, the more cells in proliferative phase. J Apoptosis levels in different SRSF10 treatment groups. K Cell cycle changes in different SRSF10 treatment groups (*P < 0.05; **P < 0.01; ***P < 0.001)

References

    1. Short N, Rytting M, Cortes J. Acute myeloid leukaemia. Lancet. 2018;392:593–606. doi: 10.1016/s0140-6736(18)31041-9. - DOI - PMC - PubMed
    1. Juliusson G, et al. Age and acute myeloid leukemia: real world data on decision to treat and outcomes from the Swedish acute leukemia registry. Blood. 2009;113:4179–4187. doi: 10.1182/blood-2008-07-172007. - DOI - PubMed
    1. DiNardo C, Perl A. Advances in patient care through increasingly individualized therapy. Nat Rev Clin Oncol. 2019;16:73–74. doi: 10.1038/s41571-018-0156-2. - DOI - PMC - PubMed
    1. DiNardo C, et al. Venetoclax combined with decitabine or azacitidine in treatment-naive, elderly patients with acute myeloid leukemia. Blood. 2019;133:7–17. doi: 10.1182/blood-2018-08-868752. - DOI - PMC - PubMed
    1. Wei A, et al. Venetoclax combined with low-dose cytarabine for previously untreated patients with acute myeloid leukemia: results from a phase Ib/II study. J Clin Oncol. 2019;37:1277–1284. doi: 10.1200/jco.18.01600. - DOI - PMC - PubMed

Publication types

MeSH terms