Systemic Activation of the Kynurenine Pathway in Graves Disease With and Without Ophthalmopathy
- PMID: 36611247
- PMCID: PMC10188306
- DOI: 10.1210/clinem/dgad004
Systemic Activation of the Kynurenine Pathway in Graves Disease With and Without Ophthalmopathy
Erratum in
-
Correction to "Systemic Activation of the Kynurenine Pathway in Graves Disease With and Without Ophthalmopathy".J Clin Endocrinol Metab. 2023 May 17;108(6):e359. doi: 10.1210/clinem/dgad067. J Clin Endocrinol Metab. 2023. PMID: 36752303 Free PMC article. No abstract available.
Abstract
Context: Graves disease (GD) is one of the most common autoimmune disorders. Recent literature has shown an immune response involving several different inflammatory related proteins in these patients.
Objective: This work aimed to characterize the kynurenine pathway, activated during interferon-γ (IFN-γ)-mediated inflammation and cellular (T-helper type 1 [Th1] type) immunity, in GD patients with and without thyroid eye disease (TED).
Methods: We analyzed 34 biomarkers by mass spectrometry in serum samples from 100 patients with GD (36 with TED) and 100 matched healthy controls. The analytes included 10 metabolites and 3 indices from the kynurenine pathway, 6 microbiota-derived metabolites, 10 B-vitamers, and 5 serum proteins reflecting inflammation and kidney function.
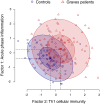
Results: GD patients showed significantly elevated levels of 7 biomarkers compared with healthy controls (omega squared [ω2] > 0.06; P < .01). Of these 7, the 6 biomarkers with the strongest effect size were all components of the kynurenine pathway. Factor analysis showed that biomarkers related to cellular immunity and the Th1 responses (3-hydroxykynurenine, kynurenine, and quinolinic acid with the highest loading) were most strongly associated with GD. Further, a factor mainly reflecting acute phase response (C-reactive protein and serum amyloid A) showed weaker association with GD by factor analysis. There were no differences in biomarker levels between GD patients with and without TED.
Conclusion: This study supports activation of IFN-γ inflammation and Th1 cellular immunity in GD, but also a contribution of acute-phase reactants. Our finding of no difference in systemic activation of the kynurenine pathway in GD patients with and without TED implies that the local Th1 immune response in the orbit is not reflected systemically.
Keywords: Graves disease; Th1 response; autoimmune; cellular immunity; kynurenine pathway; thyroid eye disease.
© The Author(s) 2023. Published by Oxford University Press on behalf of the Endocrine Society.
Figures


References
-
- Abraham-Nordling M, Byström K, Törring O, et al. . Incidence of hyperthyroidism in Sweden. Eur J Endocrinol. 2011;165(6):899‐905. - PubMed
-
- Smith TJ, Hegedüs L. Graves’ disease. N Engl J Med. 2016;375(16):1552‐1565. - PubMed
-
- Chin YH, Ng CH, Lee MH, et al. . Prevalence of thyroid eye disease in Graves’ disease: a meta-analysis and systematic review. Clin Endocrinol (Oxf). 2020;93(4):363‐374. - PubMed
-
- Smith TJ, Hegedüs L. Graves’ disease. N Engl J Med. 2016;375(16):1552‐1565. - PubMed
Publication types
MeSH terms
Substances
LinkOut - more resources
Full Text Sources
Research Materials

