. 2022 Dec 25;12(1):87.
doi: 10.3390/cells12010087.

Human Placental Endothelial Cell and Trophoblast Heterogeneity and Differentiation Revealed by Single-Cell RNA Sequencing

Affiliations

Human Placental Endothelial Cell and Trophoblast Heterogeneity and Differentiation Revealed by Single-Cell RNA Sequencing

Han Li et al. Cells. .

Abstract

Background: The placenta is an important organ for fetal and maternal health during pregnancy and impacts offspring health late in life. Defects in placental vasculature and trophoblast have been identified in several pregnancy complications. Thus, the detailed molecular profile and heterogeneity of endothelial cells and trophoblasts in placentas will aid us in better understanding placental behaviors and improving pregnancy outcomes.

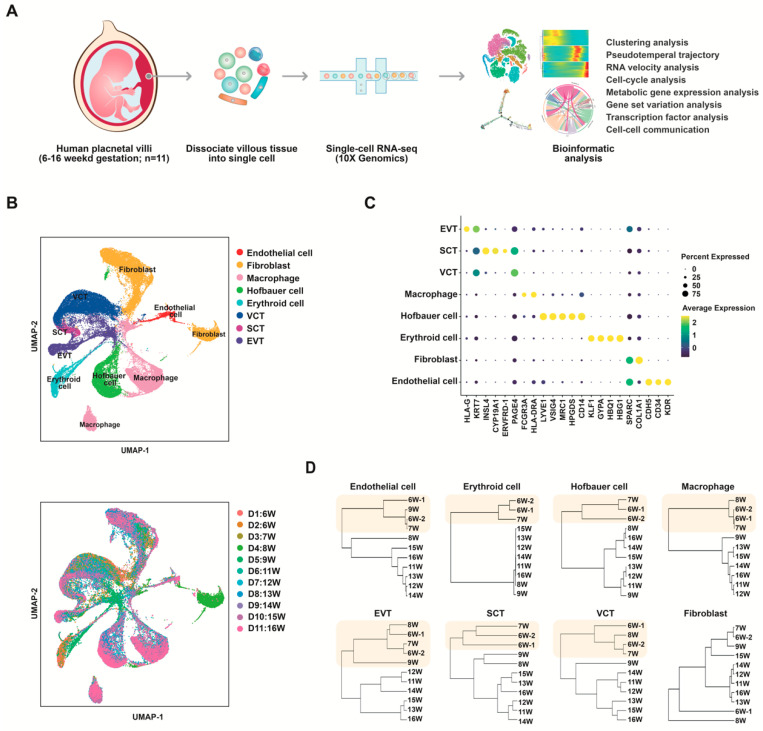
Methods: Single-cell RNA sequencing (scRNA-seq) was performed to profile the transcriptomics of human placental villous tissues from eleven patients with normal pregnancies in the first and second trimesters (6-16 weeks of gestation).

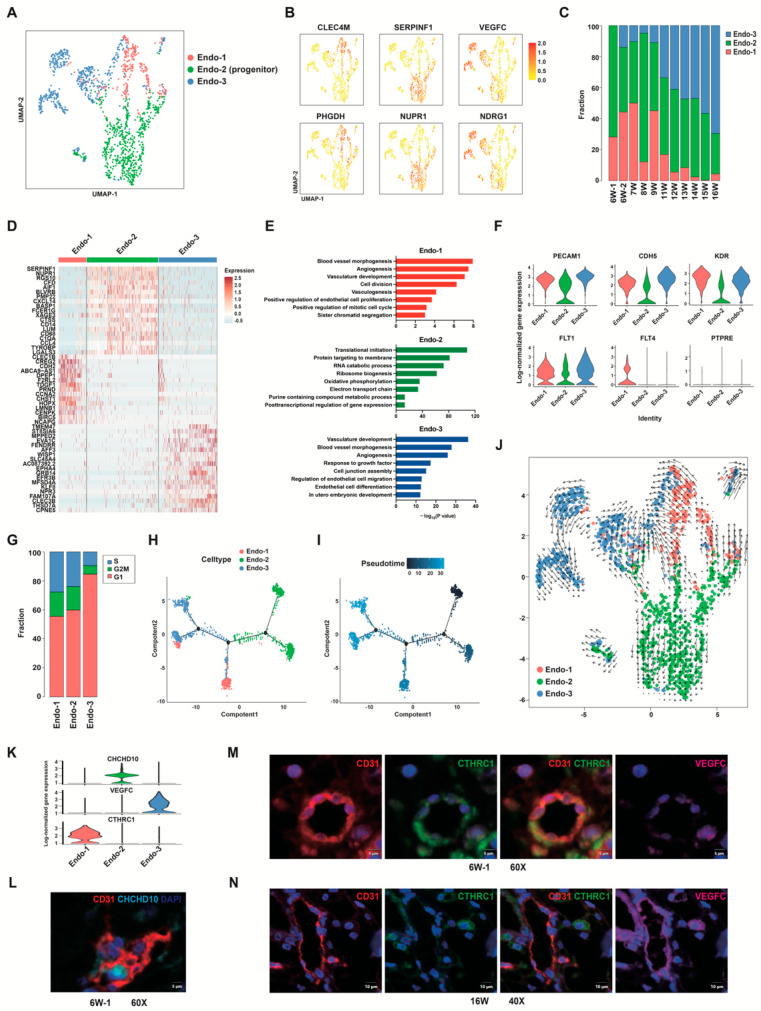
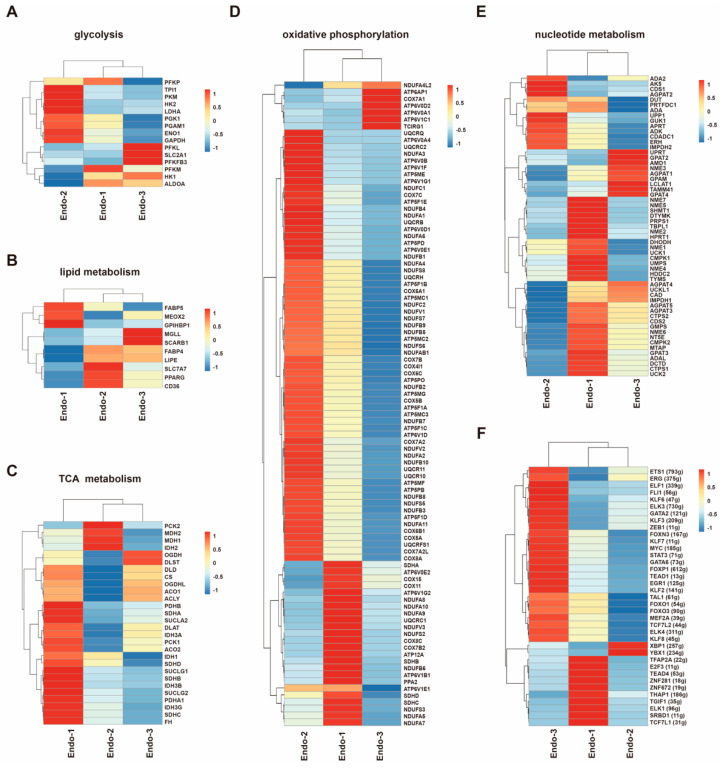
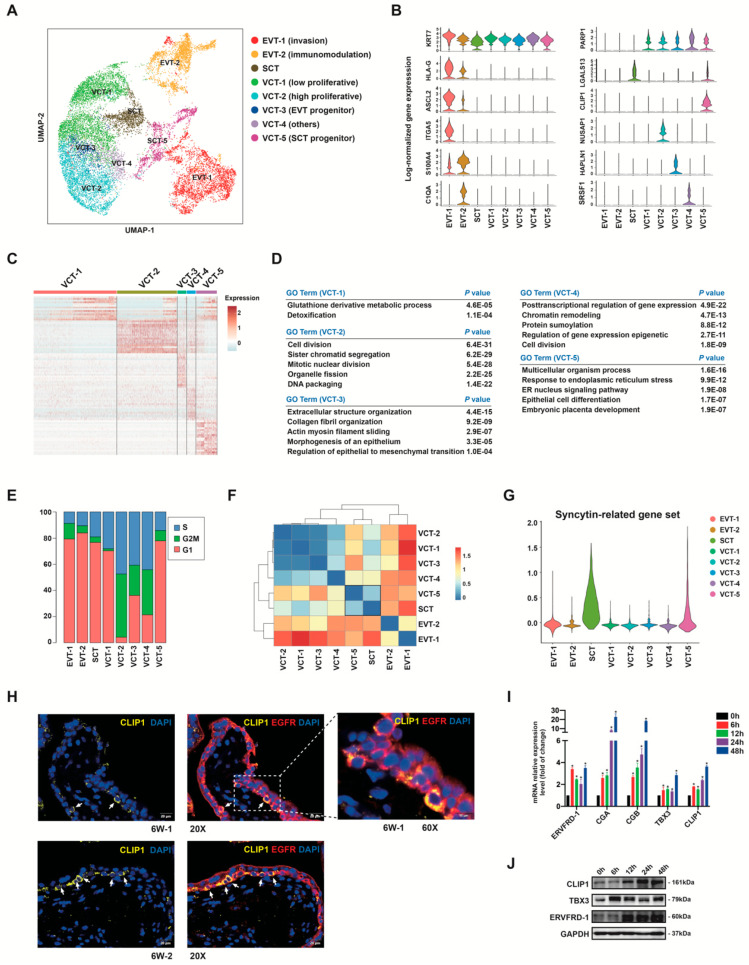
Results: The transcriptomic landscape of 52,179 single cells was obtained, and the cells were classified as trophoblasts, fibroblasts, endothelial cells, erythroid cells, Hofbauer cells, and macrophages. Our analysis further revealed the three subtypes of placental endothelial cells, with distinct metabolic signatures and transcription factor regulatory networks. We also determined the transcriptomic features of the trophoblast subpopulations and characterized two distinct populations of progenitor cells in cytotrophoblasts, which were capable of differentiating to extravillous trophoblasts and syncytiotrophoblasts, respectively.

Conclusions: Our study provided a high-resolution molecular profile of the human placenta between 6 and 16 weeks of gestation. Our data revealed the placental cell complexity and demonstrated the transcriptional networks and signaling involved in placental endothelial and trophoblast differentiation during early pregnancy, which will be a resource for future studies of the human placental development.

Keywords: endothelial cell; human placenta; pregnancy; scRNA-seq; trophoblast.


Conflict of interest statement

All authors confirm that there are no conflict of interest.

Figures

Figure 1
Figure 1
Single-cell RNA-seq of human placenta samples at 6–16 weeks of gestational age. (A) Overview of the experimental workflow. (B) UMAP plots of cells from human placenta samples, colored by cell type (top) and tissue origin (bottom). (C) Dot plot showing the selected marker genes in all cell types. (D) Dendrogram visualization of unsupervised hierarchical clustering analysis of expression phenotypes showing the relationships of cells sampled at different gestational ages.
Figure 2
Figure 2
Single-cell RNA-seq analysis of placental endothelial cells from the first and second trimesters. (A) UMAP plot showing three different subtypes of human placental endothelial cells. (B) UMAP plots of the expression distribution for selected cluster-specific genes. (C) The proportions of three EC clusters at each developmental timepoint. (D) Heatmap of top 20 DEGs in three EC clusters. (E) Representative GO analysis terms of DEGs in Endo-1 (red), Endo-2 (green) and Endo-3 (blue) clusters. (F) Violin plots showing the expression levels of endothelial markers PECAM1 and CDH5, VEGFR coding genes FLT1, FLT4, and KDR, hematopoietic marker PTPRE in each EC clusters. (G) Cell cycle analysis of three EC clusters. (H,I) Pseudotime analysis of placental endothelial cells, cells on the tree are colored by cluster (H) or pseudotime (I). (J) Projection of non-linear RNA velocity fields onto the UMAP space in (A). (K) Violin plot displaying selected cluster-specific genes. (L) Immunofluorescence staining of human first-trimester placental villi using the CD31 and CHCHD10 antibodies. DAPI staining shows the nuclei. Scale bar, 5 μm. (M) Immunofluorescence staining of human first trimester placental villi using CD31, VEGFC, CTHRC1 antibodies. Scale bar, 5 μm. (N) Immunofluorescence staining of human second trimester placental villi using CD31, VEGFC, CTHRC1 antibodies. Scale bar, 10 μm. DEGs, differentially expressed genes.
Figure 3
Figure 3
Metabolic heterogeneity and transcriptional regulatory heterogeneity in placental endothelial cells. (AE) Heatmaps of representative metabolic genes involved in glycolysis (A), lipid metabolism (B), TCA metabolism (C), oxidative phosphorylation (D), and nucleotide metabolism (E) in three EC clusters. (F) Activity heatmap of the inferred transcription-factor gene-regulatory networks (SCENIC). The t values of AUC scores of expression regulation by transcription factors are estimated using SCENIC, per EC cluster. Color scale: red, high expression; blue, low expression.
Figure 4
Figure 4
Cell subtype identification of human placental trophoblast cells. (A) UMAP plot showing eight subtypes of human placental trophoblast cells. (B) Violin plots showing the expression levels of representative marker genes across the eight clusters. Y-axis demonstrates log scale normalized read count. (C,D) Heatmap and GO enriched terms of cell type differentially expressed genes among the five VCT clusters. (E) Cell cycle analysis of eight trophoblast clusters. (F) Heatmap and the clustering structure show the dissimilarity across the trophoblast subpopulations. Blue color denotes the high similarity and red color denotes the low similarity. (G) Violin plots showing the expression levels of a representative syncytin-related gene set (ERVFRD-1, MFSD2A, ERVW-1, ASCT1, ASCT2) for each trophoblast cluster. (H) Immunofluorescence staining for the indicated VCT-5 marker CLIP1 and trophoblast marker EGFR in 6 weeks of gestation placenta. The white arrowheads indicate EGFR+CLIP1+ cells. Scale bars, 20 μm. (I,J) In vitro analysis confirmed CLIP1 is induced under fusion differentiation conditions. BeWo trophoblast cells were exposed to differentiating conditions (50 μM forskolin) for 0, 6, 12, 24, or 48 h. qRT-PCR (I) and Western blotting (J) showed the expression of CLIP1 and SCT marker genes mRNA and protein levels evaluated. * p < 0.05, n = 3.
Figure 5
Figure 5
Human trophoblast progenitor cells contribute to EVT lineages. (A) Selected top categories from KEGG and Cancer Hallmark analysis of differentially expressed genes in VCT-3. (B) Violin plots showing the relative expression of EMT genes in each VCT cluster. (C,D) Immunofluorescence staining for the indicated VCT-3 marker TAGLN, trophoblast marker EGFR, EVT marker HLA-G, proliferative cell marker Ki67 in cytotrophoblast cell columns structures of 6 weeks of gestation (C) and 14 weeks of gestation (D) placental tissue. Scale bars, 50 μm (E) Immunofluorescence staining for TAGLN in the two-layer cell structure of 6 weeks of gestation placental villi. The white arrowheads indicated VCT-3 cells, which were TAGLN and EGFR double positive, and HLA-G negative. Scale bars, 50 μm for 10× and 20 μm for 20×.
Figure 6
Figure 6
EVT subtypes and VCT to EVT differentiation analysis. (A,B) GO analysis of differentially expressed genes of EVT1 (A) and EVT2 (B). The size of the circles represents the number of significantly enriched genes in each item. The color key from blue to red indicates low to high average gene expression. (C) Immunofluorescence staining for C1QA and HLA-G in the decidua of 14 gestational weeks human placenta. The white arrowheads indicate C1QA and HLA-G double positive cells. Scale bars, 10 μm. (D) Heatmap showing the relative expression of EMT genes in each trophoblast cluster. (E,F) Pseudotime analysis of VCT-3 and EVTs, cells on the tree are colored by pseudotime (E) and cluster (F). (G) Expression pattern over pseudotime for the top 10 most variable genes were shown on the y-axis. Each column represents one cell. Expression ranged from dark blue (lowest) to red (highest). (H,I) The expression of TGF-β signaling pathway (H) and integrins (I) in trophoblast clusters. The color key from blue to yellow indicates low to high average gene expression, respectively. The dot size indicates the percentage of cells expressing a certain marker. (J) Ligand-receptor interaction analysis within trophoblast clusters. Molecule 1 is expressed by Cell 1 and Molecule 2 is expressed by Cell 2.
Figure 7
Figure 7
Immune cell and erythroid cell analysis. (A) UMAP plot and violin plots of HLA-A, HLA-B, CD9, FOLR2, and CCR4 log-normalized gene expression in Hobauer cells and macrophages. (B,C) Volcano plot of the DEGs between 6–7 weeks of gestation (6–7 W) and 14–16 weeks of gestation (14–16 W) for Hofbauer cells (B) and representative GO analysis terms of these DEGs in Hofbauer cells (C). (D,E) Volcano plot of the DEGs between 6–7 W and 14–16 W for macrophages (D) and GO analysis terms of these DEGs in macrophages (E). Genes with a log fold change greater than an absolute value of 2 were plotted. Genes with greater expression at 6–7 W are shown in red, and genes with greater expression at 14–16 W are shown in green. (F) In a pseudotime analysis of placental erythroid cells, cells on the tree were colored by state. (G) Heatmap of the top 20 DEGs of each erythroid state. (H) GO terms enriched among the DEGs of the three erythroid states. (I) Pseudotime analysis of placental erythroid cells, cells on the tree are colored by sample. DEGs, differentially expressed genes.

Similar articles

Cited by

References

    1. Knofler M., Haider S., Saleh L., Pollheimer J., Gamage T., James J. Human placenta and trophoblast development: Key molecular mechanisms and model systems. Cell. Mol. Life Sci. 2019;76:3479–3496. doi: 10.1007/s00018-019-03104-6. - DOI - PMC - PubMed
    1. Napso T., Yong H.E.J., Lopez-Tello J., Sferruzzi-Perri A.N. The Role of Placental Hormones in Mediating Maternal Adaptations to Support Pregnancy and Lactation. Front. Physiol. 2018;9:1091. doi: 10.3389/fphys.2018.01091. - DOI - PMC - PubMed
    1. Erlebacher A. Immunology of the maternal-fetal interface. Annu. Rev. Immunol. 2013;31:387–411. doi: 10.1146/annurev-immunol-032712-100003. - DOI - PubMed
    1. Maltepe E., Fisher S.J. Placenta: The forgotten organ. Annu. Rev. Cell Dev. Biol. 2015;31:523–552. doi: 10.1146/annurev-cellbio-100814-125620. - DOI - PubMed
    1. Burton G.J., Redman C.W., Roberts J.M., Moffett A. Pre-eclampsia: Pathophysiology and clinical implications. BMJ. 2019;366:l2381. doi: 10.1136/bmj.l2381. - DOI - PubMed

Publication types

LinkOut - more resources