. 2022 Dec 31;12(1):172.
doi: 10.3390/cells12010172.

Antibody-Mediated Delivery of VEGF-C Promotes Long-Lasting Lymphatic Expansion That Reduces Recurrent Inflammation

Affiliations

Antibody-Mediated Delivery of VEGF-C Promotes Long-Lasting Lymphatic Expansion That Reduces Recurrent Inflammation

Nikola Cousin et al. Cells. .

Abstract

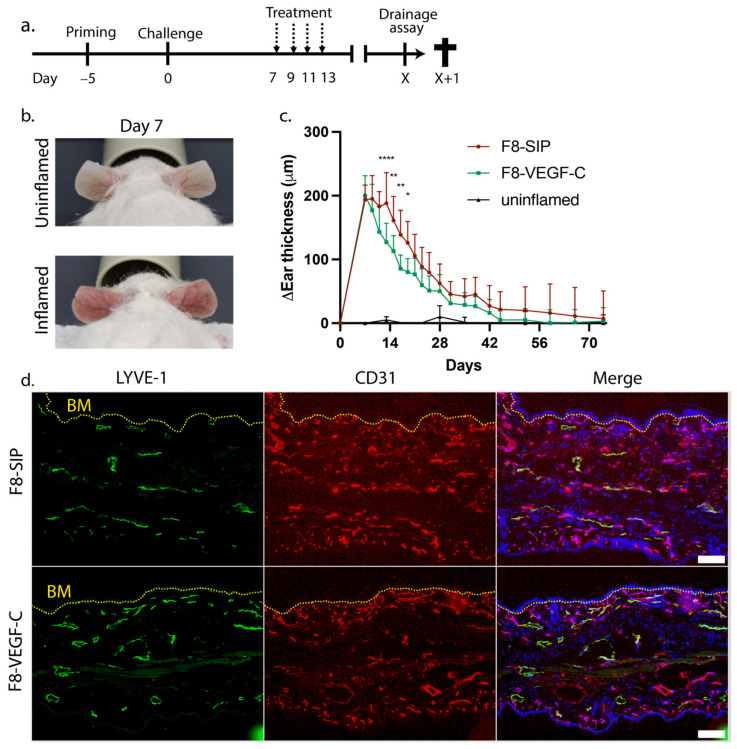
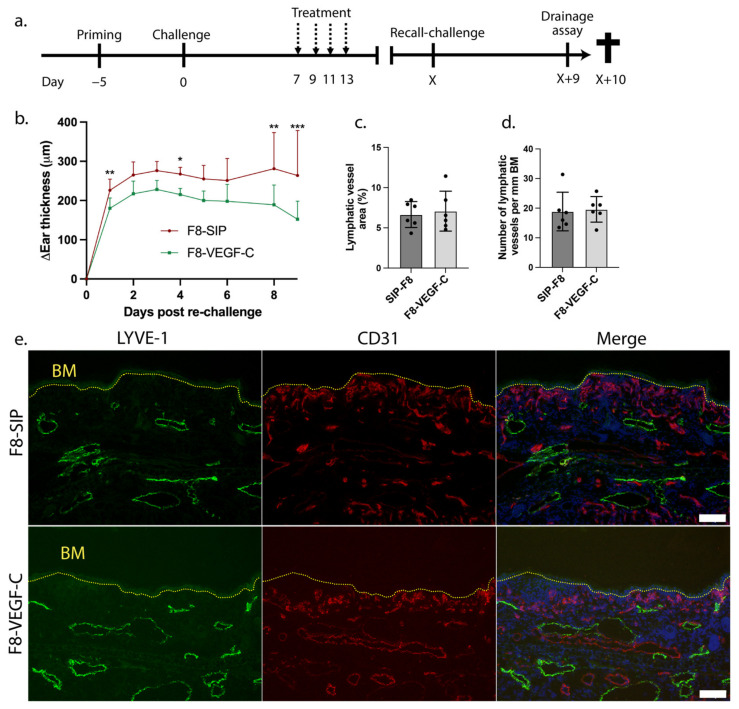
The lymphatic vascular system plays a fundamental role in inflammation by draining interstitial fluid, immune cells, antigens, and inflammatory mediators from peripheral tissues. Site-specific delivery of the lymphangiogenic growth factor VEGF-C alleviates acute inflammation in mouse models of psoriasis and chronic colitis by enhancing local drainage. However, it is unclear whether therapeutically induced lymphangiogenesis is transient or long-lasting and whether it might prevent relapses of inflammation. Here, we investigated the long-term effects of targeted VEGF-C delivery in a chronic dermatitis model in mice. Congruent with our previous results, intravenous injection with a VEGF-C fusion protein targeted to the EDA domain of fibronectin initially resulted in reduced inflammation. Importantly, we found that targeted VEGF-C-mediated expansion of lymphatic vessels in the skin persisted for more than 170 days, long after primary inflammation had resolved. Furthermore, the treatment markedly decreased tissue swelling upon inflammatory re-challenge at the same site. Simultaneously, infiltration of leukocytes, including CD4+ T cells, macrophages, and dendritic cells, was significantly reduced in the previously treated group. In conclusion, our data show that targeted delivery of VEGF-C leads to long-lasting lymphatic expansion and long-term protection against repeated inflammatory challenge, suggesting that it is a promising new approach for the treatment of chronic, recurrent inflammatory diseases.

Keywords: VEGF-C; dermatitis; lymphatic vessel; psoriasis; recurrence; targeted delivery.


Conflict of interest statement

D. Neri is the CEO and a shareholder of Philogen, a biotech company that owns and is developing derivatives of F8 antibodies for clinical applications. No funding was received from Philogen. M. Detmar and D. Neri are inventors on a pending patent for F8-VEGF-C.

Figures

Figure 1
Figure 1
(a) Schematic representation of the experimental setup with the treatment regimen on days 7, 9, 11, and 13 (dashed arrows). X indicates the day when ear thickness in both treatment groups returned to baseline, and therefore the day when inflammation was resolved. (b) Representative images of uninflamed versus inflamed ears in K14-VEGF-A transgenic mice 7 days after CHS-induced inflammation. (c) The ear thickness of F8-SIP and F8-VEGF-C-treated mice compared to pre-challenge thickness (n = 10 mice per group, 2-way ANOVA with Bonferroni post-test) until day 74. Ear thickness of uninflamed mice is shown for comparison (n = 3). (d) Representative immunofluorescence images of ears from F8-SIP and F8-VEGF-C-treated mice stained for the lymphatic marker Lyve-1 (green), the vessel marker CD31 (red), and Hoechst 33342 (blue) on day 74 post-challenge. The dotted yellow line indicates the basement membrane (BM). Size bars: 100 μm. (e) Quantification of lymphatic vessel area in % of the analyzed region of interest in F8-SIP and F8-VEGF-C-treated mice on day 74 post-challenge (expressed as mean %, n = 5 mice per group, two-tailed Student’s t-test). (f) Analysis of the number of lymphatic vessels in F8-SIP and F8-VEGF-C-treated mice in the region of interest on day 74 post-challenge (expressed as mean number per mm basement membrane length, n = 5 mice per group, two-tailed Student’s t-test). (g) Quantification of the blood vessel area as a % of the analyzed area on day 74 post-challenge (expressed as mean %, n = 5 mice per group, two-tailed Student’s t-test). One representative of two independent experiments is shown. All data are presented as mean ± SD. * p < 0.05, ** p < 0.01, **** p < 0.0001.
Figure 1
Figure 1
(a) Schematic representation of the experimental setup with the treatment regimen on days 7, 9, 11, and 13 (dashed arrows). X indicates the day when ear thickness in both treatment groups returned to baseline, and therefore the day when inflammation was resolved. (b) Representative images of uninflamed versus inflamed ears in K14-VEGF-A transgenic mice 7 days after CHS-induced inflammation. (c) The ear thickness of F8-SIP and F8-VEGF-C-treated mice compared to pre-challenge thickness (n = 10 mice per group, 2-way ANOVA with Bonferroni post-test) until day 74. Ear thickness of uninflamed mice is shown for comparison (n = 3). (d) Representative immunofluorescence images of ears from F8-SIP and F8-VEGF-C-treated mice stained for the lymphatic marker Lyve-1 (green), the vessel marker CD31 (red), and Hoechst 33342 (blue) on day 74 post-challenge. The dotted yellow line indicates the basement membrane (BM). Size bars: 100 μm. (e) Quantification of lymphatic vessel area in % of the analyzed region of interest in F8-SIP and F8-VEGF-C-treated mice on day 74 post-challenge (expressed as mean %, n = 5 mice per group, two-tailed Student’s t-test). (f) Analysis of the number of lymphatic vessels in F8-SIP and F8-VEGF-C-treated mice in the region of interest on day 74 post-challenge (expressed as mean number per mm basement membrane length, n = 5 mice per group, two-tailed Student’s t-test). (g) Quantification of the blood vessel area as a % of the analyzed area on day 74 post-challenge (expressed as mean %, n = 5 mice per group, two-tailed Student’s t-test). One representative of two independent experiments is shown. All data are presented as mean ± SD. * p < 0.05, ** p < 0.01, **** p < 0.0001.
Figure 2
Figure 2
(a) Representative images taken by the in vivo imaging system (IVIS), showing the clearance of an intradermally injected near-infrared tracer (P20D800) that is exclusively drained by lymphatic vessels in K14-VEGF-A transgenic mice, previously treated with either F8-SIP or F8-VEGF-C, on day 74 after challenge. (b) Clearance rate and (c) half-life analysis of the P20D800 tracer in F8-SIP and F8-VEGF-C-treated mice 74 days post-challenge (expressed as mean clearance rate resp. half-life, n = 4 mice per group, two-tailed Student’s t-test). (d,e) Representative immunofluorescence images of ear sections from F8-SIP and F8-VEGF-C-treated mice stained for CD45 (red, (d)) and quantification of the CD45+ area in the region of interest of F8-SIP and F8-VEGF-C-treated mice after resolution of inflammation ((e), expressed as mean %, n = 8–9 mice per group, two-tailed Student’s t-test). (f,g) Representative immunofluorescence images of CD68 (green, (f)) and quantification of the CD68+ area in the region of interest (g) of F8-SIP and F8-VEGF-C-treated mice after resolution of inflammation (expressed as mean %, n = 8–9 mice per group, two-tailed Student’s t-test). Dotted yellow line: basement membrane (BM). Size bars: 50 μm. (hj) Flow cytometry-based quantification of (h) CD45, (i) CD4, and (j) CD8-positive cells in F8-SIP and F8-VEGF-C-treated VEGF-A transgenic mice 74 days post-challenge (expressed as % of all living cells, n = 4 mice per group, two-tailed Student’s t-test). All data are presented as mean ± SD.
Figure 3
Figure 3
(a) Schematic representation of the long-term inflammation experimental setup with the treatment regimen on days 7, 9, 11, and 13 (dashed arrows). X indicates the day when the ear thickness of both treatment groups had returned to baseline, and therefore the day when inflammation was resolved. (b) Changes in ear thickness over 10 days after re-challenge in F8-SIP and F8-VEGF-C-treated K14-VEGF-A transgenic mice relative to ear thickness before re-challenge (n = 4–5 mice per group, 2-way ANOVA with Bonferroni post-test; one representative of two independent experiments shown). (c) Quantitative analysis of lymphatic vessel area as % of the region of interest at day 10 after re-challenge (expressed as a mean %, n = 6 mice per group, two-tailed Student’s t-test, one representative of two independent experiments shown). (d) Analysis of number of lymphatic vessels in previously F8-SIP and F8-VEGF-C-treated K14-VEGF-A transgenic mice on day 10 after re-challenge (expressed as mean number per mm basement membrane length, n = 6 mice per group, two-tailed Student’s t-test, one representative of two independent experiments shown). (e) Representative immunofluorescence images of ears from F8-SIP and F8-VEGF-C-treated K14-VEGF-A transgenic mice stained for Lyve-1 (green), CD31 (red), and Hoechst 33342 (blue) on day 10 after re-challenge. Dotted yellow line: basement membrane (BM). Size bars: 100 μm. All data are presented as mean ± SD. * p < 0.05, ** p < 0.01, *** p < 0.001.
Figure 4
Figure 4
(a) Representative IVIS-images showing clearance of the intradermally injected near-infrared dye P20D800 in K14-VEGF-A transgenic mice initially treated with either F8-SIP or F8-VEGF-C, 10 days after re-challenge. (b) Clearance rate and (c) half-life of the P20D800 tracer in F8-SIP and F8-VEGF-C-treated K14-VEGF-A transgenic mice 10 days after re-challenge (expressed as mean clearance rate resp. half-life, n = 4 mice per group, two-tailed Student’s t-test). (d,e) Representative immunofluorescence images (d) and quantification (e) of ears from F8-SIP and F8-VEGF-C-treated K14-VEGF-A transgenic mice stained for CD45 (red) (expressed as mean %, n = 5–6 mice per group, two-tailed student’s t-test, one representative of two independent experiments is shown). (f,g) Representative immunofluorescence images (f) and quantification (g) of ears stained for CD4 (green) (expressed as mean %, n = 5–6 mice per group, two-tailed Student’s t-test, one representative of two independent experiments is shown). (hl) Quantification of total CD45+ cells (h) and immune cell subsets (i) CD4+ Foxp3- (T helper cells), (j) CD11b+ F4/80+ (macrophages), (k) CD11c+ MHCII+ (dendritic cells), and (l) CD4+ Foxp3+ (regulatory T cells) in F8-SIP and F8-VEGF-C-treated K14-VEGF-A transgenic mice 10 days after re-challenge (expressed as % of all living cells, n = 4–5 mice per group, two-tailed Student’s t-test, one representative of two independent experiments shown). Dotted yellow line: basement membrane (BM). Size bars: 50 μm. All data are presented as mean ± SD. * p < 0.05, ** p < 0.01, *** p < 0.001.

References

    1. Cueni L.N., Detmar M. The lymphatic system in health and disease. Lymphat. Res. Biol. 2008;6:109–122. doi: 10.1089/lrb.2008.1008. - DOI - PMC - PubMed
    1. Cheuk S., Wiken M., Blomqvist L., Nylen S., Talme T., Stahle M., Eidsmo L. Epidermal Th22 and Tc17 cells form a localized disease memory in clinically healed psoriasis. J. Immunol. 2014;192:3111–3120. doi: 10.4049/jimmunol.1302313. - DOI - PMC - PubMed
    1. Peters A.S., Kellberger J., Vogelberg C., Dressel H., Windstetter D., Weinmayr G., Genuneit J., Nowak D., von Mutius E., Radon K. Prediction of the incidence, recurrence, and persistence of atopic dermatitis in adolescence: A prospective cohort study. J. Allergy Clin. Immunol. 2010;126:590–595.e3. doi: 10.1016/j.jaci.2010.06.020. - DOI - PubMed
    1. Elshabrawy H.A., Chen Z., Volin M.V., Ravella S., Virupannavar S., Shahrara S. The pathogenic role of angiogenesis in rheumatoid arthritis. Angiogenesis. 2015;18:433–448. doi: 10.1007/s10456-015-9477-2. - DOI - PMC - PubMed
    1. Kajiya K., Hirakawa S., Detmar M. Vascular endothelial growth factor-A mediates ultraviolet B-induced impairment of lymphatic vessel function. Am. J. Pathol. 2006;169:1496–1503. doi: 10.2353/ajpath.2006.060197. - DOI - PMC - PubMed

Publication types

Substances

LinkOut - more resources