

Cuproptosis-Related MiR-21-5p/FDX1 Axis in Clear Cell Renal Cell Carcinoma and Its Potential Impact on Tumor Microenvironment
- PMID: 36611966
- PMCID: PMC9818076
- DOI: 10.3390/cells12010173
Cuproptosis-Related MiR-21-5p/FDX1 Axis in Clear Cell Renal Cell Carcinoma and Its Potential Impact on Tumor Microenvironment
Abstract
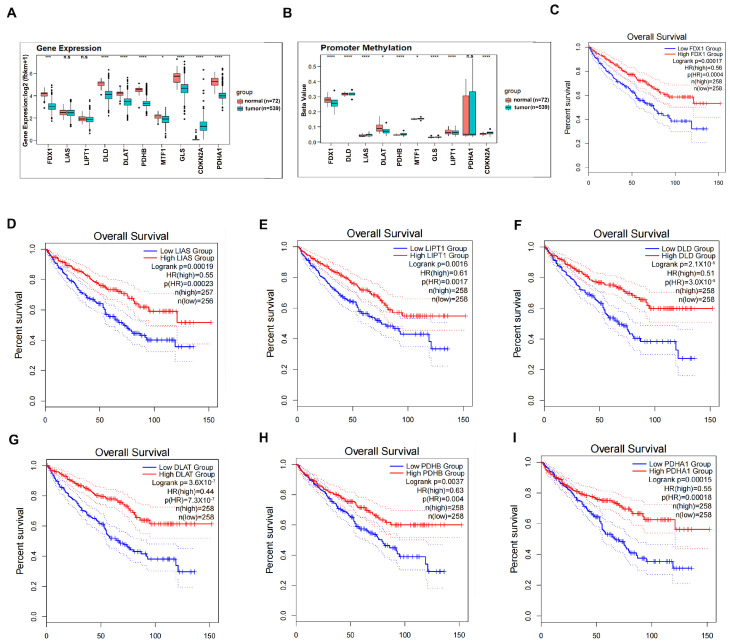
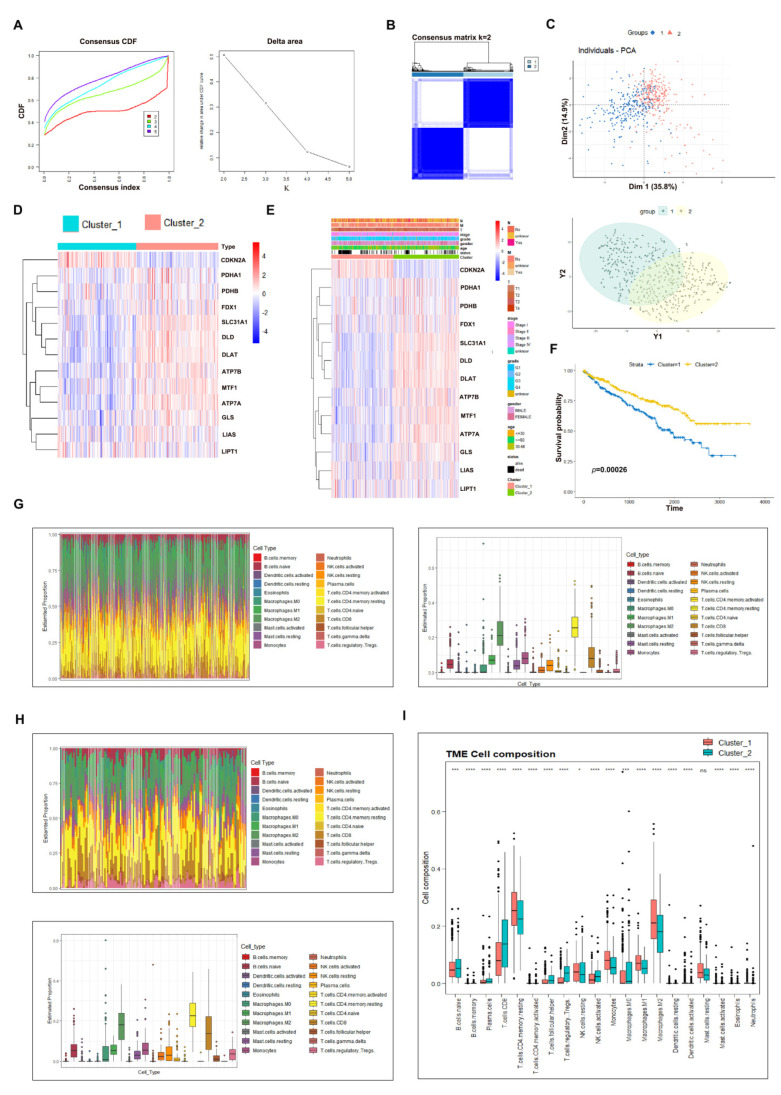
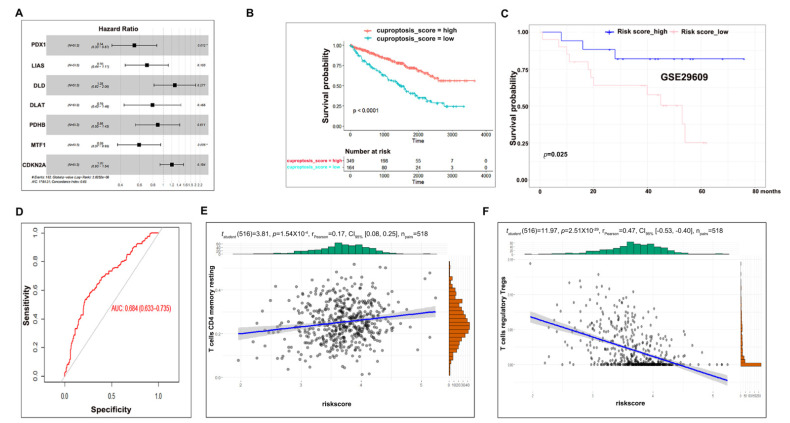
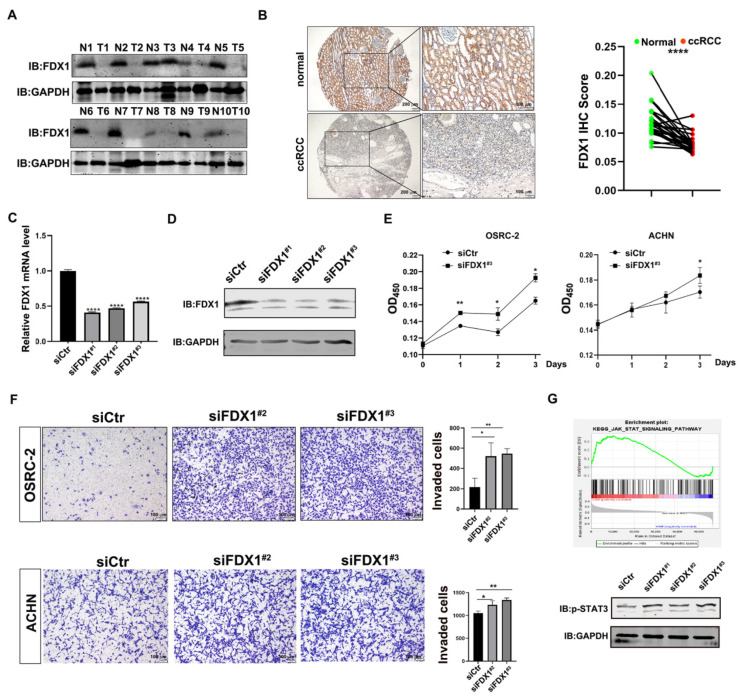
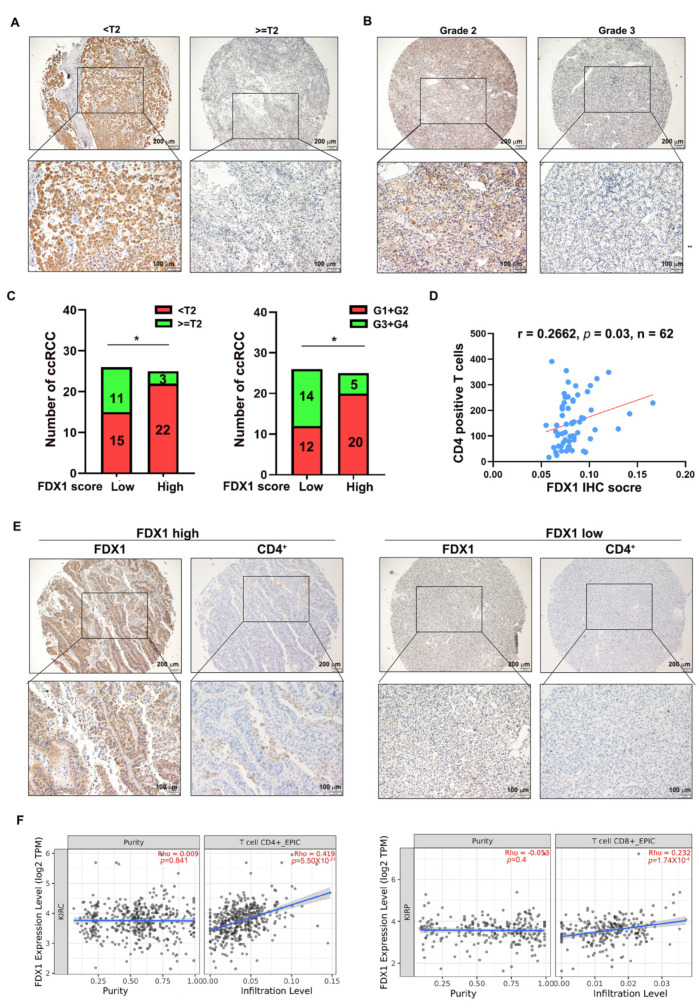
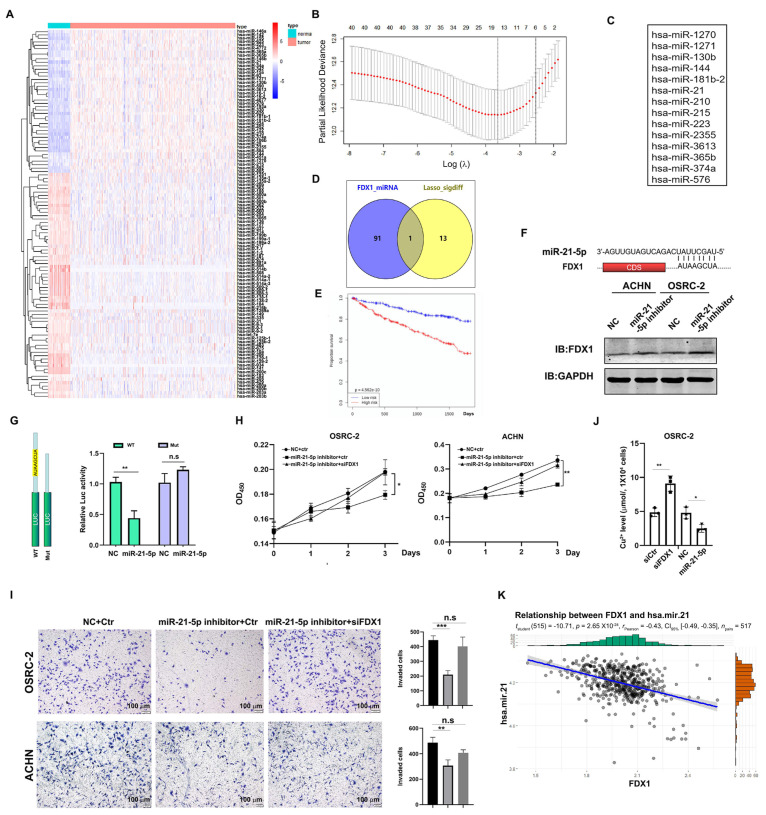
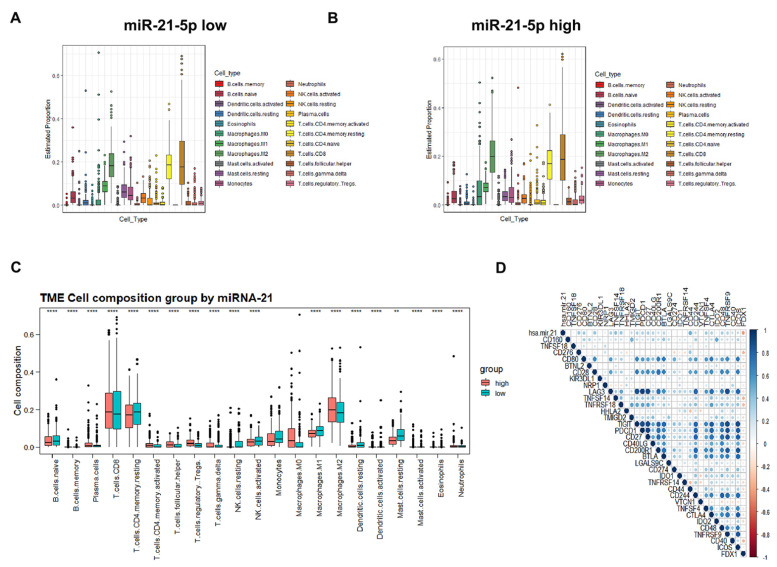
As a newly identified type of programmed cell death, cuproptosis may have an impact on cancer development, including clear cell renal cell carcinoma (ccRCC). Herein, we first noticed that the expression levels of cuproptosis regulators exhibited a tight correlation with the clinicopathological characteristics of ccRCC. The cuproptosis-sensitive sub-type (CSS), classified via consensus clustering analysis, harbored a higher overall survival rate compared to the cuproptosis-resistant sub-type (CRS), which may have resulted from the differential infiltration of immune cells. FDX1, the cuproptosis master regulator, was experimentally determined as a tumor suppressor in ccRCC cells by suppressing the cell growth and cell invasion of ACHN and OSRC-2 cells in a cuproptosis-dependent and -independent manner. The results from IHC staining also demonstrated that FDX1 expression was negatively correlated with ccRCC tumor initiation and progression. Furthermore, we identified the miR-21-5p/FDX1 axis in ccRCC and experimentally verified that miR-21-5p directly binds the 3'-UTR of FDX1 to mediate its degradation. Consequently, a miR-21-5p inhibitor suppressed the cell growth and cell invasion of ACHN and OSRC-2 cells, which could be compensated by FDX1 knockdown, reinforcing the functional linkage between miR-21-5p and FDX1 in ccRCC. Finally, we evaluated the ccRCC tumor microenvironment under the miR-21-5p/FDX1 axis and noted that this axis was strongly associated with the infiltration of immune cells such as CD4+ T cells, Treg cells, and macrophages, suggesting that this signaling axis may alter microenvironmental components to drive ccRCC progression. Overall, this study constructed the miR-21-5p/FDX1 axis in ccRCC and analyzed its potential impact on the tumor microenvironment, providing valuable insights to improve current ccRCC management.
Keywords: FDX1; cuproptosis; miR-21-5p; microenvironment; renal cell carcinoma.
Conflict of interest statement
The authors have declared that there are no conflict of interest related to this manuscript.
Figures
Similar articles
-
Cuproptosis-related gene FDX1 expression correlates with the prognosis and tumor immune microenvironment in clear cell renal cell carcinoma.Front Immunol. 2022 Sep 26;13:999823. doi: 10.3389/fimmu.2022.999823. eCollection 2022. Front Immunol. 2022. PMID: 36225932 Free PMC article.
-
Comprehensive investigation into cuproptosis in the characterization of clinical features, molecular characteristics, and immune situations of clear cell renal cell carcinoma.Front Immunol. 2022 Oct 6;13:948042. doi: 10.3389/fimmu.2022.948042. eCollection 2022. Front Immunol. 2022. PMID: 36275737 Free PMC article.
-
A Novel Cuproptosis-Related Prognostic Gene Signature and Validation of Differential Expression in Clear Cell Renal Cell Carcinoma.Genes (Basel). 2022 May 10;13(5):851. doi: 10.3390/genes13050851. Genes (Basel). 2022. PMID: 35627236 Free PMC article.
-
The potential of targeting cuproptosis in the treatment of kidney renal clear cell carcinoma.Biomed Pharmacother. 2023 Nov;167:115522. doi: 10.1016/j.biopha.2023.115522. Epub 2023 Sep 25. Biomed Pharmacother. 2023. PMID: 37757497 Review.
-
The Tumor Immune Microenvironment in Clear Cell Renal Cell Carcinoma.Int J Mol Sci. 2023 Apr 27;24(9):7946. doi: 10.3390/ijms24097946. Int J Mol Sci. 2023. PMID: 37175653 Free PMC article. Review.
Cited by
-
Retinoic acid mitigates the NSC319726-induced spermatogenesis dysfunction through cuproptosis-independent mechanisms.Cell Biol Toxicol. 2024 May 1;40(1):26. doi: 10.1007/s10565-024-09857-6. Cell Biol Toxicol. 2024. PMID: 38691186 Free PMC article.
-
Big data analysis and machine learning of the role of cuproptosis-related long non-coding RNAs (CuLncs) in the prognosis and immune landscape of ovarian cancer.Front Immunol. 2025 Feb 25;16:1555782. doi: 10.3389/fimmu.2025.1555782. eCollection 2025. Front Immunol. 2025. PMID: 40070821 Free PMC article.
-
Identification of cuproptosis-related genes in septic shock based on bioinformatic analysis.PLoS One. 2024 Dec 9;19(12):e0315219. doi: 10.1371/journal.pone.0315219. eCollection 2024. PLoS One. 2024. PMID: 39652607 Free PMC article.
-
[The advancement of cuproptosis in hematological tumors].Zhonghua Xue Ye Xue Za Zhi. 2024 Oct 14;45(10):965-969. doi: 10.3760/cma.j.cn121090-20240327-00116. Zhonghua Xue Ye Xue Za Zhi. 2024. PMID: 39622763 Free PMC article. Review. Chinese.
-
Rhomboid-like 2 correlated with TME infiltration inhibits cuproptosis-related genes and drives malignant phenotype in clear cell renal cell carcinoma.Sci Rep. 2024 Nov 7;14(1):27053. doi: 10.1038/s41598-024-78713-8. Sci Rep. 2024. PMID: 39511359 Free PMC article.
References
Publication types
MeSH terms
Substances
LinkOut - more resources
Full Text Sources
Medical
Research Materials
