. 2023 Jan 3;12(1):189.
doi: 10.3390/cells12010189.

Maternal Hyperhomocysteinemia Disturbs the Mechanisms of Embryonic Brain Development and Its Maturation in Early Postnatal Ontogenesis

Affiliations

Maternal Hyperhomocysteinemia Disturbs the Mechanisms of Embryonic Brain Development and Its Maturation in Early Postnatal Ontogenesis

Dmitrii S Vasilev et al. Cells. .

Abstract

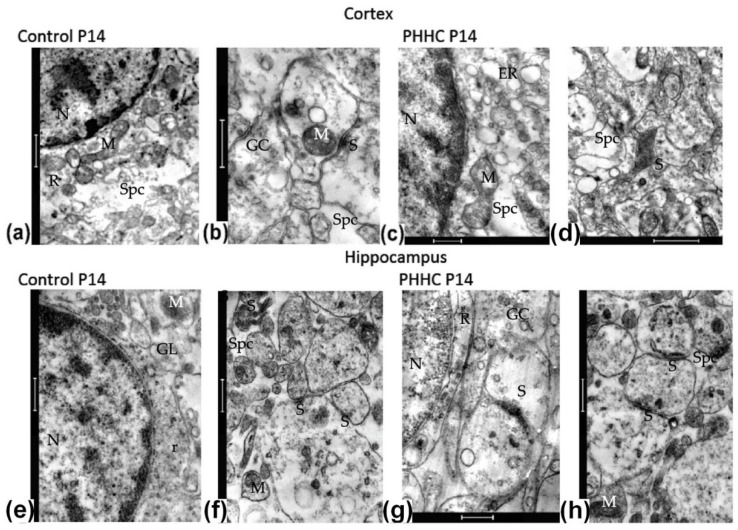
Maternal hyperhomocysteinemia causes the disruption of placental blood flow and can lead to serious disturbances in the formation of the offspring's brain. In the present study, the effects of prenatal hyperhomocysteinemia (PHHC) on the neuronal migration, neural tissue maturation, and the expression of signaling molecules in the rat fetal brain were described. Maternal hyperhomocysteinemia was induced in female rats by per os administration of 0.15% aqueous methionine solution in the period of days 4-21 of pregnancy. Behavioral tests revealed a delay in PHHC male pups maturing. Ultrastructure of both cortical and hippocampus tissue demonstrated the features of the developmental delay. PHHC was shown to disturb both generation and radial migration of neuroblasts into the cortical plate. Elevated Bdnf expression, together with changes in proBDNF/mBDNF balance, might affect neuronal cell viability, positioning, and maturation in PHHC pups. Reduced Kdr gene expression and the content of SEMA3E might lead to impaired brain development. In the brain tissue of E20 PHHC fetuses, the content of the procaspase-8 was decreased, and the activity level of the caspase-3 was increased; this may indicate the development of apoptosis. PHHC disturbs the mechanisms of early brain development leading to a delay in brain tissue maturation and formation of the motor reaction of pups.

Keywords: caspase; electron microscopy; hippocampus; homocysteine; matrix metalloproteinase; neocortex; neurodegeneration; neurotrophins; rat; semaphorin.


Conflict of interest statement

The authors declare no conflict of interest.

Figures

Scheme 1
Scheme 1
Schematic outline of the experimental study design. (a) Treatment paradigm followed during the study. (b) Timing of the behavior studies in male descendant pups.
Figure 1
Figure 1
Effects of PHHC on body weight and the neurobehavioral characteristics in rat pups of the control (n = 35–36) and PHHC (prenatal hyperhomocysteinemia, n = 47–49) groups. Data are presented as mean ± SEM. *—p ≤ 0.05. The significance of the difference between the PHHC and control groups were determined by two-way ANOVA with Student–Newman–Keuls post hoc analysis (ad), or by one-way ANOVA with Student–Newman–Keuls post hoc analysis (e). (a) Body weight in grams on P1-P21. (b) Body righting test in scores on P1-P8. (c) Whisker placing test in scores on P1-P15. (d) Rotating grid test (angle in degrees) on P1-P15. (e) Locomotor activity (number crossing squares in open field test) on P14-P25.
Figure 2
Figure 2
Localization and positioning of the cortical neurons generated on E14 or E18. (a) Position of the analyzed areas of the parietal cortex (Bregma +0.20 mm [35]). (b) Position of the studied area in CA1 area of dorsal hippocampus (Bregma −4.50 mm [35]). (c) Sample of the double labeling of parietal cortex in a P5 control rat. EdU labeling were performed on E14 (left) or E18 (right). Fox3-positive neurons stained by PE-conjugated secondary antibodies (red); EdU-positive cell nuclei were labeled by AlexaFluor488 (green). Scale bar 20 µm. (d) Coronal section of the parietal cortex in control pups on P5. EdU labeling (green nuclei on the lower photographs) on E14. Upper photographs show blue cellular nuclei stained by Hoechst 33342. The majority of the cells labeled on E14 are localized in the V-VI cortical layers. Scale bar 70 µm. (e) Coronal section of the parietal cortex of a P5 PHHC pup. EdU-labeling was performed on E14. Scale bar 70 µm. (f) Coronal section of the parietal cortex of a control rat on P5 with EdU-labeling performed on E18. The majority of the cells labeled on E18 are scattered within the superficial cortical layers. Scale bar 70 µm. (g) A coronal section of the parietal cortex of a P5 PHHC pup. EdU-labeling was performed on E18. Scale bar 70 µm.
Figure 3
Figure 3
Analysis of cortical neuron positioning after cell labeling on E14 or E18. Cells were counted in 500 µm-wide area of the cortical plate from the layers I to VI. (a) Total number of EdU-positive cells labeled on E14 in the area of interest of parietal cortex of control (n = 12) and PHHC (n = 9) pups. (b) Number of EdU-positive cells labeled on E14 in the II-III layers of the area of interest in parietal cortex of control (n = 12) and PHHC (n = 9) pups. (c) Total number of EdU-positive cells labeled on E18 in the area of interest of parietal cortex of control (n = 12) and PHHC (n = 12) pups. (d) Number of EdU-positive cells labeled on E18 in the V-VI layers of the area of interest of parietal cortex of control (n = 12) and PHHC (n = 12) pups. Data presented as the median (25th, 75th percentile). Significance of difference between the PHHC and control groups was determined by the Mann–Whitney U test (*—p ≤ 0.05, **—p ≤ 0.01).
Figure 4
Figure 4
Microphotographs of the parietal cortex (ad) and CA1 of dorsal hippocampus (eh) tissue in P5 pups of control (a,b,e,f) and PHHC (c,d,g,h) groups. Electron microscopy. Spc—extracellular spaces; N—neuron; S—synapse; R—ribosomes; GC—growth cone; ER—endoplasmic reticulum; M—mitochondria; L—lysosomes; D—dendrite processes; GL—glial processes; G—Golgi complex. Scale: (b,d,h)—500 nm, (a,c,e,f,g)—1 µm.
Figure 5
Figure 5
Ultrastructure of the parietal cortex (ad) and CA1 of dorsal hippocampus (eh) tissue in P14 pups of control (a,b,e,f) and PHHC (c,d,g,h) groups. Electron microscopy. Spc—extracellular spaces; N—neuron; S—synapse; R—ribosomes; M—mitochondria; ER—endoplasmic reticulum; GC—growth cone; GL—glial processes. Scale: (b,d,h)—500 nm, (a,c,e,f,g)—1 µm.
Figure 6
Figure 6
Ultrastructure of the parietal cortex (ad) and CA1 of dorsal hippocampus (eh) tissue in P20 pups of control (a,b,e,f) and PHHC (c,d,g,h) groups. Electron microscopy. N—neuron; D—dendritic processes; M—mitochondria; S—synapse; GC—growth cone; Spc—extracellular spaces; R—ribosomes; ER—endoplasmic reticulum; GL—glial processes. Scale: (b,f,h)—500 nm, (a,c,d,e,g)—1 µm.
Figure 7
Figure 7
The level of expression and content of components of the neurotrophin system in the brain of fetal rats on the 14th (E14) and 20th (E20) days of prenatal development. (a) The expression level of the Bdnf, Ngf, Trka, Trkb, and P75ntr genes in the fetal brain of rats in the control group (Control, n = 6) and in the group with prenatal hyperhomocysteinemia (PHHC, n = 6). (b) The content of proBDNF and mBDNF in the brain of fetal rats in the control group (Control, n = 20–29) and in the group of animals who underwent prenatal hyperhomocysteinemia (PHHC, n = 23–34). (c) The content of proNGF in the brain of fetal rats in the control group (Control, n = 21–24) and in the group of animals who underwent prenatal hyperhomocysteinemia (PHHC, n = 23–25). (d) Representative Western blots are shown for each condition. The data are presented as mean and the standard error of the mean (mean ± SEM). *—a significant difference between the experimental group and the corresponding control (p ≤ 0.05). &&—a significant difference in the proBDNF level in the control group on E20 from the control on E14 (p ≤ 0.01). &&&—a significant difference in the level of proNGF in the control group on E20 from the control on E14 (p ≤ 0.001).
Figure 8
Figure 8
The content and activity of caspases in the fetal rat brain on the 14th (E14) and 20th (E20) days of prenatal development. (a) The content of Caspase-3 fragments in the fetal rat brain in the control group (Control, n = 14) and in the group of animals who underwent prenatal hyperhomocysteinemia (PHHC, n = 14). (b) The activity of Caspase-3 in the fetal rat brain on E14 and E20 in the control group (Control, n = 8–21) and in the group of animals with prenatal hyperhomocysteinemia (PHHC, n = 8–21). (c) The content of Caspase-8 fragments in the fetal rat brain in the control group (Control, n = 10–14) and in the group of animals after prenatal hyperhomocysteinemia (PHHC, n = 10–14). (d) Representative Western blots are shown for each condition. The data are presented as mean and standard error of mean (mean ± SEM). *—significant difference between the experimental group and the corresponding control (p ≤ 0.05).
Figure 9
Figure 9
The expression and content of the angiogenesis system components in the fetal brain of rats on the 14th (E14) and 20th (E20) days of prenatal development. (a) The expression level of Vegfa, Vegfb, and Kdr genes in the rat fetal brain in the control group (Control, n = 6) and in the group with prenatal hyperhomocysteinemia (PHHC, n = 6). (b) The content of VEGFA in the fetal rat brain from the control group (Control, n = 4–8) and in the group of animals after prenatal hyperhomocysteinemia (PHHC, n = 4–8). (c) The content of SEMA3E in the fetal rat brain in the control group (Control, n = 6–10) and in the group of animals after prenatal hyperhomocysteinemia (PHHC, n = 7–11). (d) MMP-2 activity in the fetal rat brain in the control group (Control, n = 8–9) and in the group of animals after prenatal hyperhomocysteinemia (PHHC, n = 7–8). (e) Representative Western blots and gelatin zymograms are shown for each condition. The data are presented as mean and standard error of mean (mean ± SEM). *—significant difference between the experimental group and the corresponding control (p ≤ 0.05).
Figure 10
Figure 10
Oxidative modifications of macromolecules in the fetal rat brain on the 20th (E20) day of prenatal development. (a) Quantitative analysis of the content of products of oxidative modification of proteins in the fetal rat brain in the control group (Control, n = 16) and after prenatal hyperhomocysteinemia (PHHC, n = 16). (b) Representative oxyblot is shown for each condition. (c) The level of lipid peroxidation (content of malondialdehyde, MDA) in the brain of rat fetuses (n = 19–20). *—p ≤ 0.05.

Similar articles

Cited by

References

    1. Blaise S.A., Nedelec E., Schroeder H., Alberto J.M., Bossenmeyer-Pourie C., Gueant J.L., Daval J.L. Gestational vitamin B deficiency leads to homocysteine-associated brain apoptosis and alters neurobehavioral development in rats. Am. J. Pathol. 2007;170:667–679. doi: 10.2353/ajpath.2007.060339. - DOI - PMC - PubMed
    1. Schweinberger B.M., Rodrigues A.F., Dos Santos T.M., Rohden F., Barbosa S., da Luz Soster P.R., Partata W.A., Faccioni-Heuser M.C., Wyse A.T.S. Methionine administration in pregnant rats causes memory deficit in the offspring and alters ultrastructure in brain tissue. Neurotox. Res. 2018;33:239–246. doi: 10.1007/s12640-017-9830-x. - DOI - PubMed
    1. Shcherbitskaia A.D., Vasilev D.S., Milyutina Y.P., Tumanova N.L., Zalozniaia I.V., Kerkeshko G.O., Arutjunyan A.V. Maternal Hyperhomocysteinemia Induces Neuroinflammation and Neuronal Death in the Rat Offspring Cortex. Neurotox. Res. 2020;38:408–420. doi: 10.1007/s12640-020-00233-w. - DOI - PubMed
    1. Shcherbitskaia A.D., Vasilev D.S., Milyutina Y.P., Tumanova N.L., Mikhel A.V., Zalozniaia I.V., Arutjunyan A.V. Prenatal Hyperhomocysteinemia Induces Glial Activation and Alters Neuroinflammatory Marker Expression in Infant Rat Hippocampus. Cells. 2021;10:1536. doi: 10.3390/cells10061536. - DOI - PMC - PubMed
    1. da Cunha A.A., Ferreira A.G., Wyse A.T. Increased inflammatory markers in brain and blood of rats subjected to acute homocysteine administration. Metab. Brain Dis. 2010;25:199–206. doi: 10.1007/s11011-010-9188-8. - DOI - PubMed

Publication types