. 2022 Dec 30;15(1):226.
doi: 10.3390/cancers15010226.

Deep Learning-Based Screening of Urothelial Carcinoma in Whole Slide Images of Liquid-Based Cytology Urine Specimens

Affiliations

Deep Learning-Based Screening of Urothelial Carcinoma in Whole Slide Images of Liquid-Based Cytology Urine Specimens

Masayuki Tsuneki et al. Cancers (Basel). .

Erratum in

Abstract

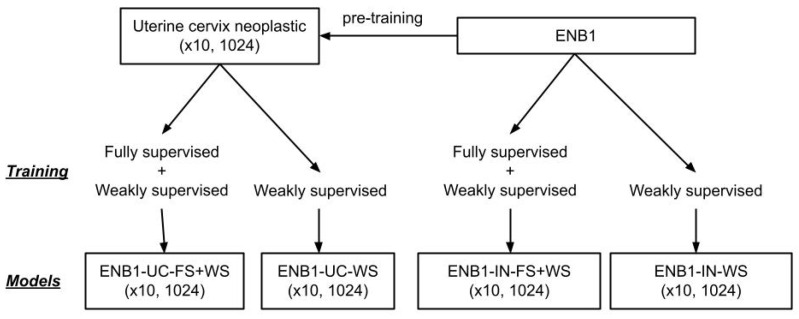
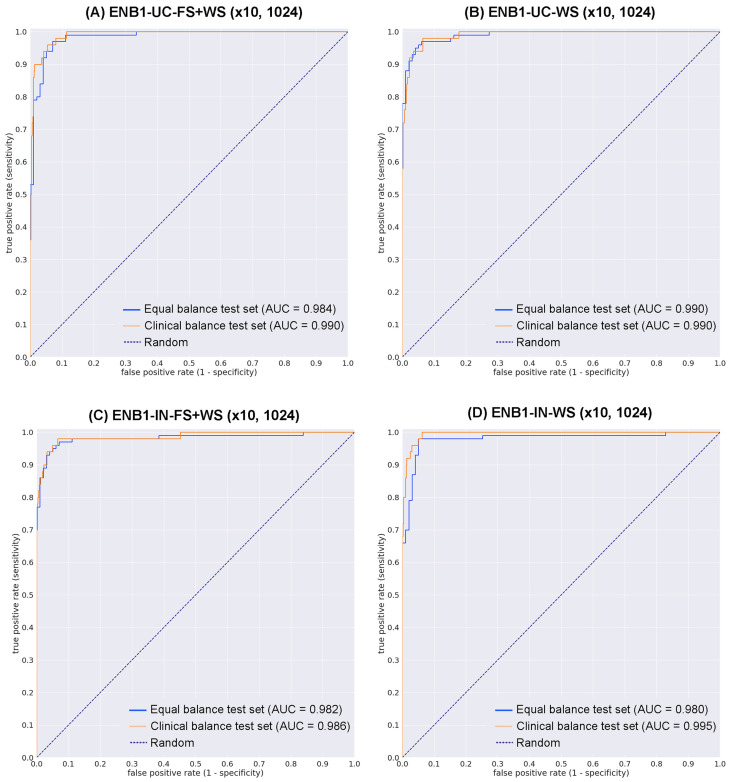
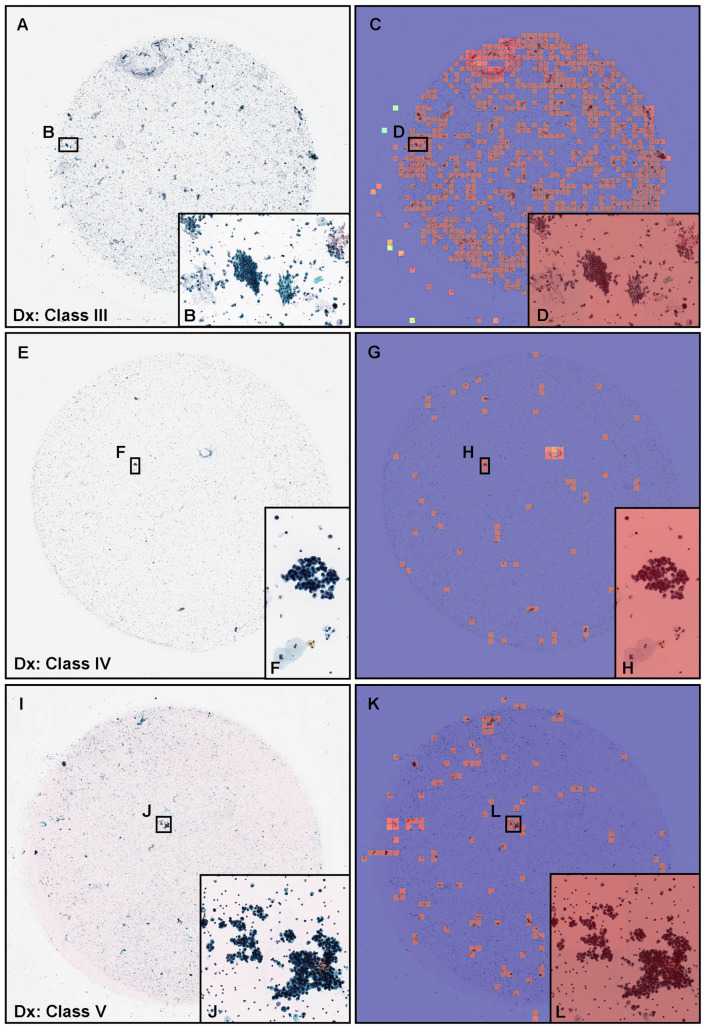
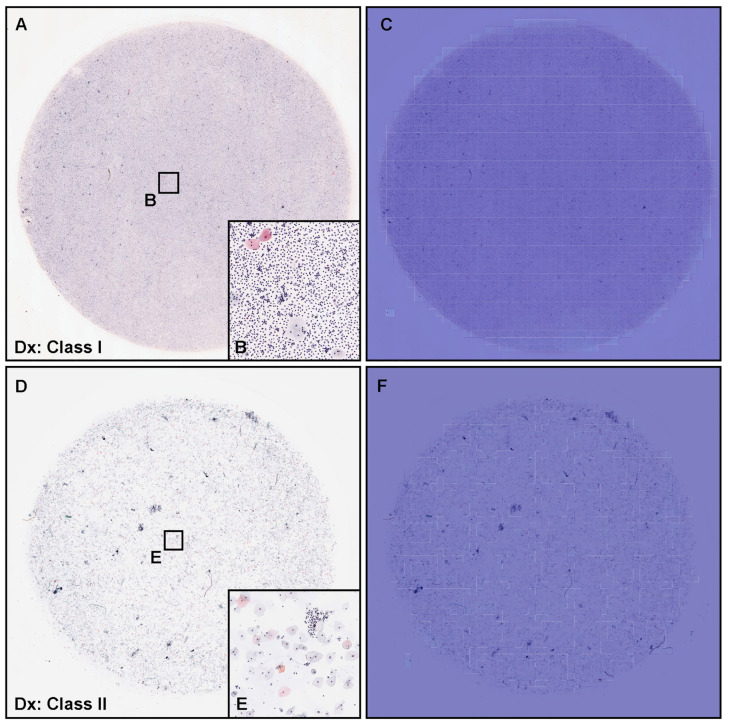
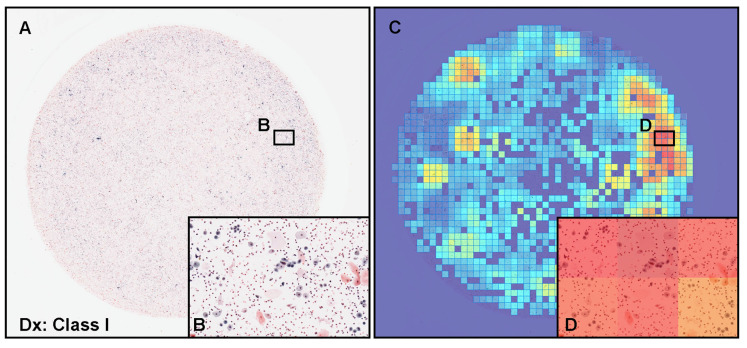
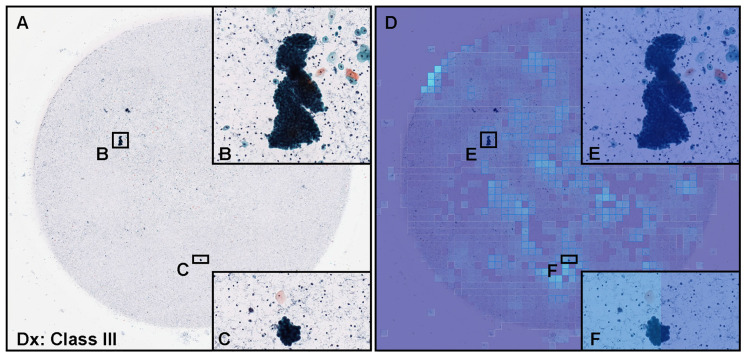
Urinary cytology is a useful, essential diagnostic method in routine urological clinical practice. Liquid-based cytology (LBC) for urothelial carcinoma screening is commonly used in the routine clinical cytodiagnosis because of its high cellular yields. Since conventional screening processes by cytoscreeners and cytopathologists using microscopes is limited in terms of human resources, it is important to integrate new deep learning methods that can automatically and rapidly diagnose a large amount of specimens without delay. The goal of this study was to investigate the use of deep learning models for the classification of urine LBC whole-slide images (WSIs) into neoplastic and non-neoplastic (negative). We trained deep learning models using 786 WSIs by transfer learning, fully supervised, and weakly supervised learning approaches. We evaluated the trained models on two test sets, one of which was representative of the clinical distribution of neoplastic cases, with a combined total of 750 WSIs, achieving an area under the curve for diagnosis in the range of 0.984-0.990 by the best model, demonstrating the promising potential use of our model for aiding urine cytodiagnostic processes.

Keywords: cancer screening; deep learning; liquid-based cytology; urine; urothelial carcinoma; whole slide image.


Conflict of interest statement

M.T. and F.K. are employees of Medmain Inc. All authors declare no competing interest.

Figures

Figure 1
Figure 1
Representative manually drawing annotation image for neoplastic labels on urine liquid-based cytology (LBC) whole slide images (WSIs). The atypical urothelial cells (A,B) were annotated as atypical cell label. The suspected low grade urothelial carcinoma (LGUC) cells (C,D) were annotated as LGUC cell label and high grade utorhelial carcinoma (HGUC) cells (E,F) were annotated as HGUC cell label. The three labels (atypical cell, LGUC cell, and HGUC cell) were grouped as neoplastic label for fully supervised learning. Scale bars are 50 μ m.
Figure 2
Figure 2
Training method and deep learning models overview. We performed training using two different weight initialisations: ImageNet (IN) and pre-training on a uterine cervix (UC) neoplastic (×10, 1024) dataset from a previous study. We used two different approaches for training: fully supervised (FS) and weakly supervised (WS) learning. This resulted in a total of four models, all trained at magnification ×10 and tile size 1024 × 1024px: ENB1-UC-FS+WS, ENB1-UC-WS, ENB1-IN-FS+WS, and ENB1-IN-WS.
Figure 3
Figure 3
ROC curves on the test sets. (A) transfer learning (TL) from uterine cervix liquid-based cytology (LBC) model and fully and weakly supervised learning model, magnification at ×10 and tile size at 1024 × 1024 px (ENB1-UC-FS+WS (×10, 1024)); (B) TL from uterine cervix LBC model and weakly supervised learning model, magnification at ×10 and tile size at 1024 × 1024 px (ENB1-UC-WS (×10, 1024)); (C) EfficientNetB1 based fully and weakly supervised learning model, magnification at ×10 and tile size at 1024 × 1024 px (ENB1-IN-FS+WS (×10, 1024)); (D) EfficientNetB1 based weakly supervised learning model, magnification at ×10 and tile size at 1024 × 1024 px (ENB1-IN-WS (×10, 1024)).
Figure 4
Figure 4
Neoplastic prediction comparison. Comparison of neoplastic predictions in the representative two neoplastic urine liquid-based cytology (LBC) whole-slide images (WSIs) (WSI-1 and WSI-2) of four trained deep learning models (ENB1-UC-FS+WS, ENB1-UC-WS, ENB1-IN-FS+WS, and ENB1-IN-WS). According to the cytopathological diagnostic (Dx) reports, WSI-1 (AL) was diagnosed as Class III and WSI-2 (MX) was diagnosed as Class IV—both were classified in the neoplastic class in this study. (AD,MP): LBC cytopathological images for WSI-1 (AD) and WSI-2 (MO); heatmap prediction images for ENB1-UC-FS+WS model in WSI-1 (E,F) and WSI-2 (Q,R); heatmap prediction images for ENB1-UC-WS model in WSI-1 (G,H) and WSI-2 (S,T); heatmap prediction images for ENB1-IN-FS+WS model in WSI-1 (I,J) and WSI-2 (U,V); heatmap prediction images for ENB1-IN-WS model in WSI-1 (K,L) and WSI-2 (W,X). The localization of predicted tiles in neoplastic WSIs (WSI-1 and WSI-2) were almost same in four models (ENB1-UC-FS+WS, ENB1-UC-WS, ENB1-IN-FS+WS, and ENB1-IN-WS). However, the model pre-trained from uterine cervix LBC model with fully and weakly supervised learning (ENB1-UC-FS+WS) showed the highest neoplastic probabilities (F,R) in neoplastic tiles (BD,NP) as compared to other models (GL,SX). The heatmap uses the jet color map where blue indicates low probability and red indicates high probability.
Figure 5
Figure 5
Representative examples of true positive prediction. Neoplastic true positive prediction outputs on urine liquid-based cytology (LBC) whole-slide images (WSIs) from test sets using the ENB1-UC-FS+WS model. According to the cytopathological diagnostic (Dx) reports, (A) was diagnosed as Class III with atypical urothelial epithelial cells (B), (E) was diagnosed as Class IV with suspected low grade urothelial carcinoma (LGUC) cells (F), and (I) was diagnosed as Class V with suspected high grade utorhelial carcinoma (HGUC) cells (J). The heatmap images (C,D,G,H,K,L) show true positive predictions of neoplastic urothelial epithelial cells (D,H,L), which correspond, respectively, to atypical (B), suspected LGUC (F), and HGUC (J) cells. The heatmap uses the jet color map where blue indicates low probability and red indicates high probability.
Figure 6
Figure 6
Representative examples of true negative prediction. Two representative examples of neoplastic true negative prediction outputs on urine liquid-based cytology (LBC) whole-slide images (WSIs) from test sets using ENB1-UC-FS+WS model. According to the cytopathological diagnostic (Dx) reports, (A) was diagnosed as Class I and (B) was Class II, which were negative for urothelial neoplastic epithelial cells. Cytopathologically, (A) was pyuria which consisted of infective fluid (pus) with small number of non-atypical epithelial cells (B). (D,E) included urothelial epithelial cells with slight nuclear enlargement. The heatmap images (C,F) show true negative prediction of neoplastic epithelial cells. The heatmap uses the jet color map where blue indicates low probability and red indicates high probability.
Figure 7
Figure 7
Representative example of false positive prediction. A representative example of neoplastic false positive prediction outputs on urine liquid-based cytology (LBC) whole-slide images (WSIs) from test sets using the ENB1-UC-FS+WS model. According to the cytopathological diagnostic (Dx) report, (A) was diagnosed as Class I and consisted of metaplastic squamous epithelial cells and non-atypical (non-neoplastic) urothelial epithelial cells with inflammatory cells (B). The heatmap images (C,D) show false positive predictions (D) which correspond, respectively, to (B). The heatmap uses the jet color map where blue indicates low probability and red indicates high probability.
Figure 8
Figure 8
Representative example of false negative prediction. A representative example of neoplastic false negative prediction outputs on urine liquid-based cytology (LBC) whole-slide images (WSIs) from test sets using the ENB1-UC-FS+WS model. According to the cytopathological diagnostic (Dx) report, (A) was diagnosed as Class III and included clusters of atypical urothelial epithelial cells (B,C). The heatmap images (DF) show false negative predictions (E,F) which correspond, respectively, to (B,C). The heatmap uses the jet color map where blue indicates low probability and red indicates high probability.

References

    1. Northrup V., Acar B.C., Hossain M., Acker M.R., Manuel E., Rahmeh T. Clinical follow up and the impact of the Paris system in the assessment of patients with atypical urine cytology. Diagn. Cytopathol. 2018;46:1022–1030. doi: 10.1002/dc.24095. - DOI - PubMed
    1. Brown F.M. Urine Cytology. Urol. Clin. N. Am. 2000;27:25–37. doi: 10.1016/S0094-0143(05)70231-7. - DOI - PubMed
    1. DeSouza K., Chowdhury S., Hughes S. Prompt diagnosis key in bladder cancer. Practitioner. 2014;258:23–27. - PubMed
    1. Sung H., Ferlay J., Siegel R.L., Laversanne M., Soerjomataram I., Jemal A., Bray F. Global cancer statistics 2020: GLOBOCAN estimates of incidence and mortality worldwide for 36 cancers in 185 countries. CA Cancer J. Clin. 2021;71:209–249. doi: 10.3322/caac.21660. - DOI - PubMed
    1. Shanks J.H., Iczkowski K.A. Divergent differentiation in urothelial carcinoma and other bladder cancer subtypes with selected mimics. Histopathology. 2009;54:885–900. doi: 10.1111/j.1365-2559.2008.03167.x. - DOI - PubMed

LinkOut - more resources