

Factors Associated with the Prevalence and Severity of Menstrual-Related Symptoms: A Systematic Review and Meta-Analysis
- PMID: 36612891
- PMCID: PMC9819475
- DOI: 10.3390/ijerph20010569
Factors Associated with the Prevalence and Severity of Menstrual-Related Symptoms: A Systematic Review and Meta-Analysis
Abstract
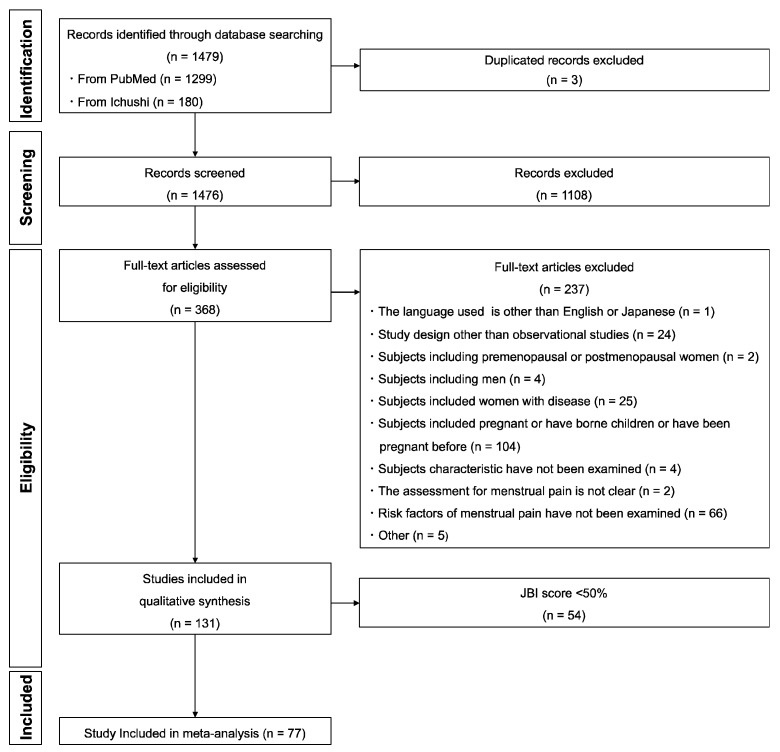
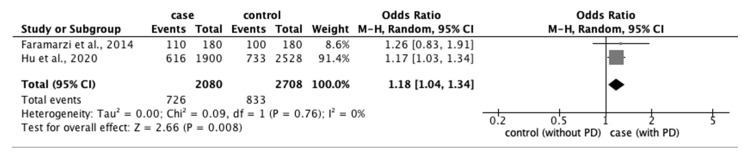
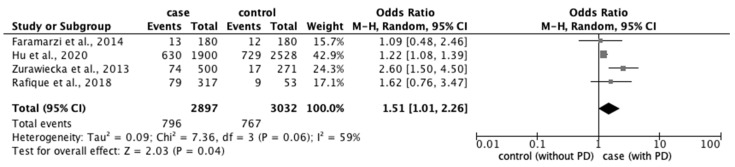
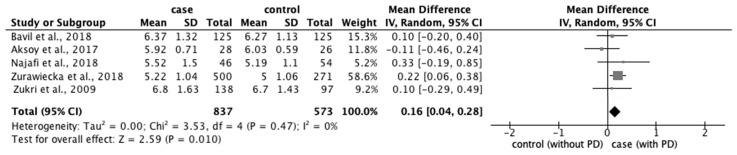
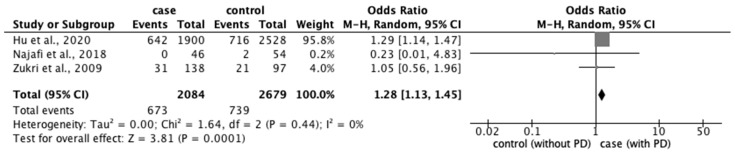
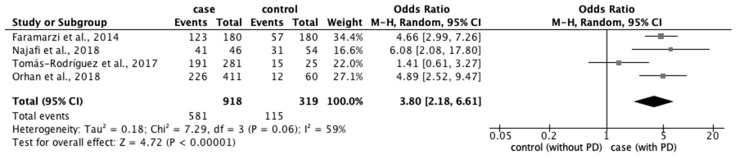
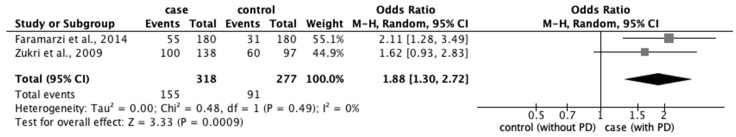
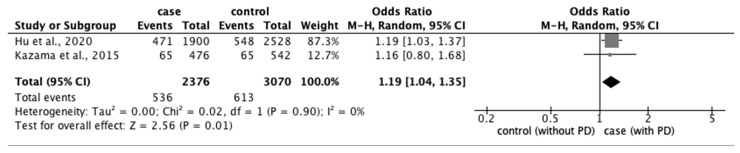
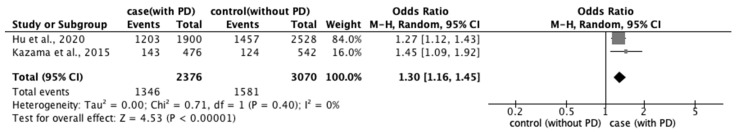
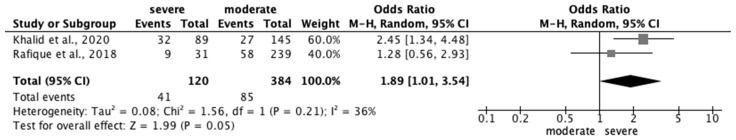
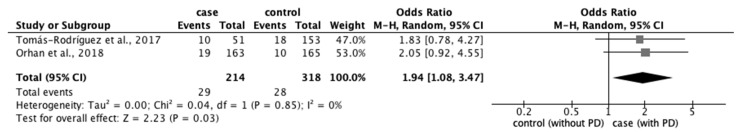
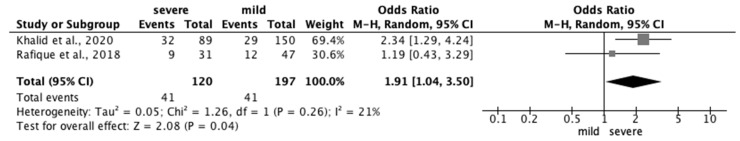
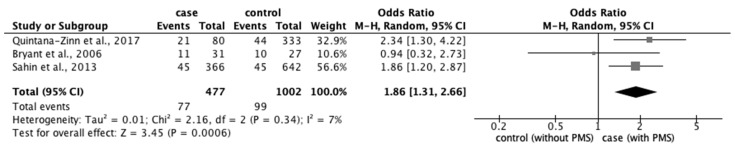
This study aimed to identify factors associated with the prevalence and severity of menstrual-related symptoms. The protocol was registered in PROSPERO (CRD42021208432). We conducted literature searches of PubMed and Ichushi-Web and used the Jonna Briggs Institute critical appraisal checklist to assess the quality. Of the 77 studies included in the meta-analysis, significant odds ratios (ORs) were obtained for eight factors associated with primary dysmenorrhea (PD): age ≥ 20 years (OR: 1.18; 95% confidence interval [CI]: 1.04−1.34), body mass index (BMI) < 18.5 kg/m2 (OR: 1.51; 95% CI: 1.01−2.26), longer menstrual periods (OR: 0.16; 95% CI: 0.04−0.28), irregular menstrual cycle (OR: 1.28; 95% CI: 1.13−1.45), family history of PD (OR: 3.80; 95% CI: 2.18−6.61), stress (OR: 1.88; 95% CI: 1.30−2.72), sleeping hours < 7 h (OR: 1.19; 95% CI: 1.04−1.35), and bedtime after 23:01 (OR: 1.30; 95% CI: 1.16−1.45). Two factors were associated with severity of PD (moderate vs. severe): BMI < 18.5 kg/m2 (OR: 1.89; 95% CI: 1.01−3.54) and smoking (OR: 1.94; 95% CI: 1.08−3.47). PD severity (mild vs. severe) and prevalence of premenstrual syndrome were associated with BMI < 18.5 kg/m2 (OR: 1.91; 95% CI: 1.04−3.50) and smoking (OR: 1.86; 95% CI: 1.31−2.66), respectively. The identified risk factors could be utilized to construct an appropriate strategy to improve menstrual symptoms and support women’s health.
Keywords: menstrual-related symptoms; premenstrual syndrome; primary dysmenorrhea; risk factors.
Conflict of interest statement
The authors declare no conflict of interest.
Figures
Similar articles
-
Menstrual Disorders Are Associated With Depressive Symptoms Among Women of Reproductive Age: Findings From the Korean Women's Health Survey for Sexual and Reproductive Health.J Korean Med Sci. 2025 Jun 30;40(25):e123. doi: 10.3346/jkms.2025.40.e123. J Korean Med Sci. 2025. PMID: 40589356 Free PMC article.
-
Interventions to prevent or treat heavy menstrual bleeding or pain associated with intrauterine-device use.Cochrane Database Syst Rev. 2022 Aug 26;8(8):CD006034. doi: 10.1002/14651858.CD006034.pub3. Cochrane Database Syst Rev. 2022. PMID: 36017945 Free PMC article.
-
Treatments for seizures in catamenial (menstrual-related) epilepsy.Cochrane Database Syst Rev. 2021 Sep 16;9(9):CD013225. doi: 10.1002/14651858.CD013225.pub3. Cochrane Database Syst Rev. 2021. PMID: 34528245 Free PMC article.
-
Menstrual hygiene practices and associated factors among Indian adolescent girls: a meta-analysis.Reprod Health. 2022 Jun 23;19(1):148. doi: 10.1186/s12978-022-01453-3. Reprod Health. 2022. PMID: 35739585 Free PMC article.
-
Nifedipine for primary dysmenorrhoea.Cochrane Database Syst Rev. 2021 Dec 18;12(12):CD012912. doi: 10.1002/14651858.CD012912.pub2. Cochrane Database Syst Rev. 2021. PMID: 34921554 Free PMC article.
Cited by
-
Effects of Weather on the Severity of Menstrual Symptoms Among College- and High School-Going Women in the Southern Regions of Saudi Arabia.Cureus. 2024 Aug 13;16(8):e66786. doi: 10.7759/cureus.66786. eCollection 2024 Aug. Cureus. 2024. PMID: 39268266 Free PMC article.
-
The Changes in Menstrual and Menstrual-Related Symptoms among Japanese Female University Students: A Prospective Cohort Study from Three Months to Nine Months after Admission.Healthcare (Basel). 2023 Sep 15;11(18):2557. doi: 10.3390/healthcare11182557. Healthcare (Basel). 2023. PMID: 37761754 Free PMC article.
-
Menstrual cycle symptomatology during the COVID-19 pandemic: The role of interoceptive sensibility and psychological health.Compr Psychoneuroendocrinol. 2023 May;14:100182. doi: 10.1016/j.cpnec.2023.100182. Epub 2023 Mar 7. Compr Psychoneuroendocrinol. 2023. PMID: 36911251 Free PMC article.
-
Physical activity and combined hormonal contraception: association with female students' perception of menstrual symptoms.Front Physiol. 2023 May 17;14:1185343. doi: 10.3389/fphys.2023.1185343. eCollection 2023. Front Physiol. 2023. PMID: 37265844 Free PMC article.
-
Morbidity Pattern in Young Unmarried Women Attending Gynecology Clinics at King Abdulaziz Medical City in Riyadh, Saudi Arabia.Cureus. 2025 Jun 15;17(6):e86088. doi: 10.7759/cureus.86088. eCollection 2025 Jun. Cureus. 2025. PMID: 40672025 Free PMC article.
References
Publication types
MeSH terms
LinkOut - more resources
Full Text Sources
Medical
