

Thermophysiological and Perceptual Responses of Amateur Healthcare Workers: Impacts of Ambient Condition, Inner-Garment Insulation and Personal Cooling Strategy
- PMID: 36612933
- PMCID: PMC9819836
- DOI: 10.3390/ijerph20010612
Thermophysiological and Perceptual Responses of Amateur Healthcare Workers: Impacts of Ambient Condition, Inner-Garment Insulation and Personal Cooling Strategy
Abstract
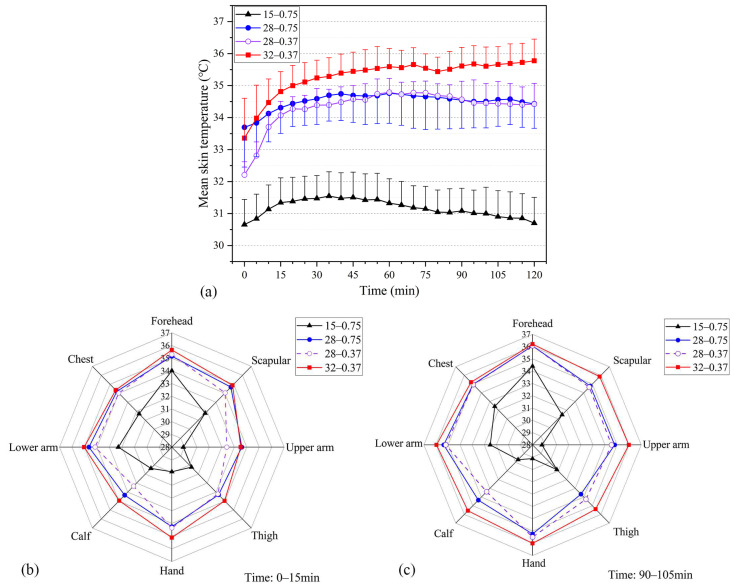
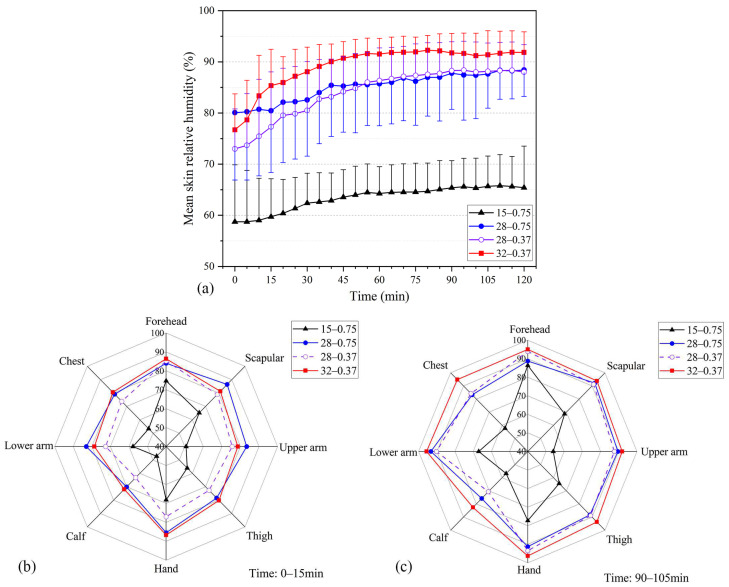
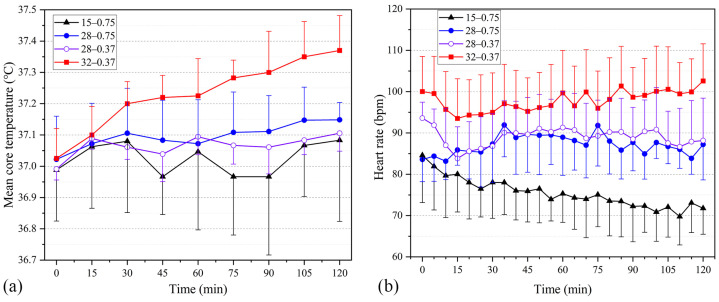
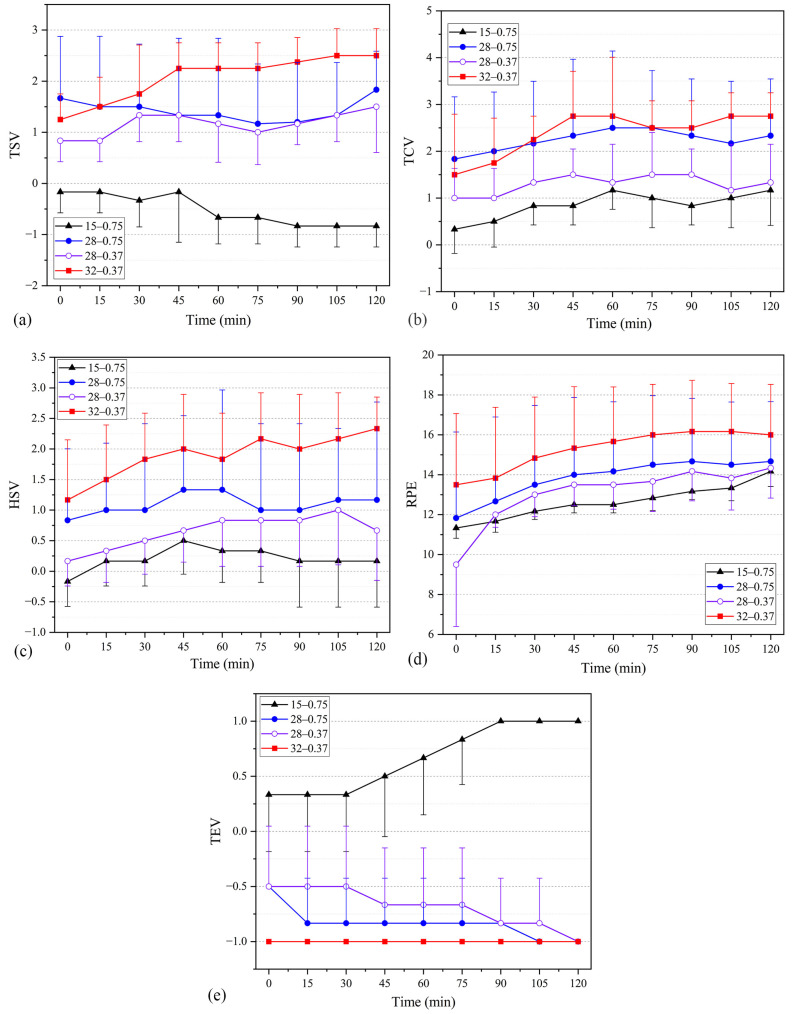
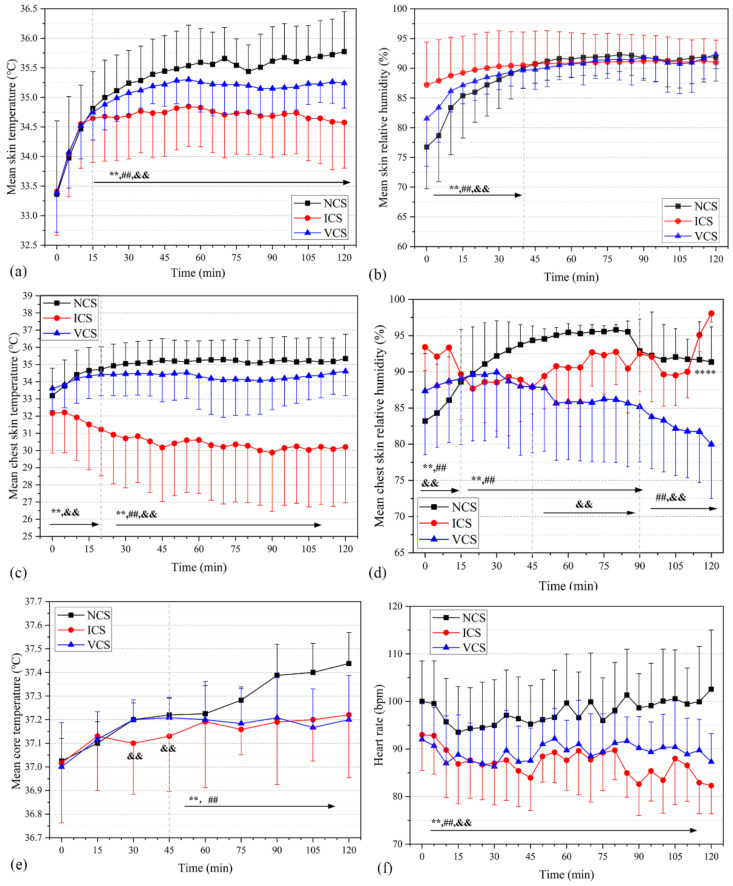
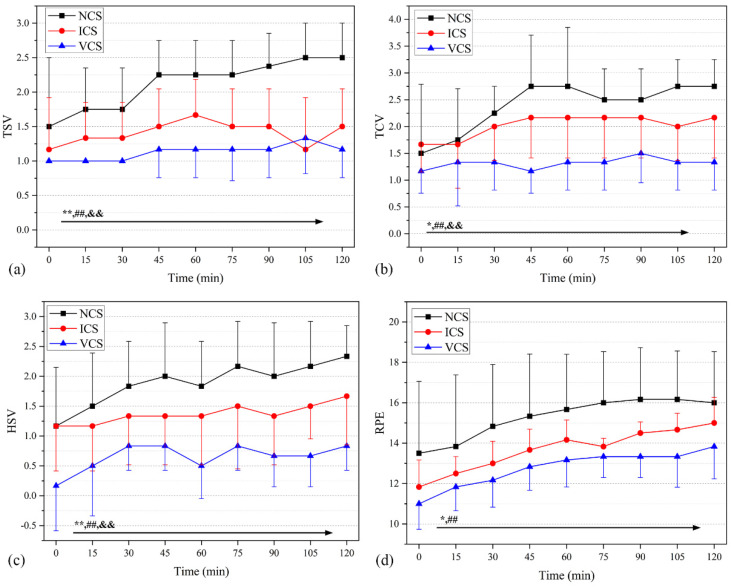
While personal protective equipment (PPE) protects healthcare workers from viruses, it also increases the risk of heat stress. In this study, the effects of environmental heat stress, the insulation of the PPE inner-garment layer, and the personal cooling strategy on the physiological and perceptual responses of PPE-clad young college students were evaluated. Three levels of wet bulb globe temperatures (WBGT = 15 °C, 28 °C, and 32 °C) and two types of inner garments (0.37 clo and 0.75 clo) were chosen for this study. In an uncompensable heat stress environment (WBGT = 32 °C), the effects of two commercially available personal cooling systems, including a ventilation cooling system (VCS) and an ice pack cooling system (ICS) on the heat strain mitigation of PPE-clad participants were also assessed. At WBGT = 15 °C with 0.75 clo inner garments, mean skin temperatures were stabilized at 31.2 °C, Hskin was 60-65%, and HR was about 75.5 bpm, indicating that the working scenario was on the cooler side. At WBGT = 28 °C, Tskin plateaued at approximately 34.7 °C, and the participants reported "hot" thermal sensations. The insulation reduction in inner garments from 0.75 clo to 0.37 clo did not significantly improve the physiological thermal comfort of the participants. At WBGT = 32 °C, Tskin was maintained at 35.2-35.7 °C, Hskin was nearly 90% RH, Tcore exceeded 37.1 °C, and the mean HR was 91.9 bpm. These conditions indicated that such a working scenario was uncompensable, and personal cooling to mitigate heat stress was required. Relative to that in NCS (no cooling), the mean skin temperatures in ICS and VCS were reduced by 0.61 °C and 0.22 °C, respectively, and the heart rates were decreased by 10.7 and 8.5 bpm, respectively. Perceptual responses in ICS and VCS improved significantly throughout the entire field trials, with VCS outperforming ICS in the individual cooling effect.
Keywords: COVID-19; healthcare workers; personal cooling; personal protective equipment; thermal comfort.
Conflict of interest statement
The authors declare no conflict of interest.
Figures
Similar articles
-
Practical Considerations for Using Personal Cooling Garments for Heat Stress Management in Physically Demanding Occupations: A Systematic Review and Meta-Analysis Using Realist Evaluation.Am J Ind Med. 2025 Jan;68(1):3-25. doi: 10.1002/ajim.23672. Epub 2024 Nov 5. Am J Ind Med. 2025. PMID: 39498663 Free PMC article.
-
Performance enhancement of hybrid personal cooling clothing in a hot environment: PCM cooling energy management with additional insulation.Ergonomics. 2019 Jul;62(7):928-939. doi: 10.1080/00140139.2019.1596318. Epub 2019 Apr 22. Ergonomics. 2019. PMID: 30885053
-
Intermittent wetting clothing as a cooling strategy for body heat strain alleviation of vulnerable populations during a severe heatwave incident.J Therm Biol. 2019 Jan;79:33-41. doi: 10.1016/j.jtherbio.2018.11.012. Epub 2018 Nov 26. J Therm Biol. 2019. PMID: 30612683
-
Human thermal physiological response of wearing personal protective equipment: An educational building semi-open space experimental investigation.Sci Total Environ. 2023 Jun 15;877:162779. doi: 10.1016/j.scitotenv.2023.162779. Epub 2023 Mar 15. Sci Total Environ. 2023. PMID: 36924973 Free PMC article.
-
Personal protective equipment and personal cooling garments to reduce heat-related stress and injuries.Med Leg J. 2020 Nov;88(1_suppl):43-46. doi: 10.1177/0025817220935882. Epub 2020 Jul 27. Med Leg J. 2020. PMID: 32716247 Review.
Cited by
-
Physical fitness status and associated determinants among Chinese children aged 9-12 years in Shandong province: a population-based cross-sectional study.Sci Rep. 2025 Aug 9;15(1):29221. doi: 10.1038/s41598-025-13319-2. Sci Rep. 2025. PMID: 40783637 Free PMC article.
-
Effect of ecoliteracy on farmers' participation in pesticide packaging waste governance behavior in rural North China.Sci Rep. 2024 Oct 4;14(1):23103. doi: 10.1038/s41598-024-73858-y. Sci Rep. 2024. PMID: 39367047 Free PMC article.
References
-
- Aparicio Betancourt M., Duarte-Díaz A., Vall-Roqué H., Seils L., Orrego C., Perestelo-Pérez L., Barrio-Cortes J., Beca-Martínez M.T., Molina Serrano A., Bermejo-Caja C.J., et al. Global healthcare needs related to COVID-19: An evidence map of the first year of the pandemic. Int. J. Environ. Res. Public Health. 2022;19:10332. doi: 10.3390/ijerph191610332. - DOI - PMC - PubMed
Publication types
MeSH terms
LinkOut - more resources
Full Text Sources
Medical
