Multicenter Study
. 2022 Dec 21;24(1):156.
doi: 10.3390/ijms24010156.

A Novel Molecular Signature of Cancer-Associated Fibroblasts Predicts Prognosis and Immunotherapy Response in Pancreatic Cancer

Affiliations
Multicenter Study

A Novel Molecular Signature of Cancer-Associated Fibroblasts Predicts Prognosis and Immunotherapy Response in Pancreatic Cancer

Weiyu Ge et al. Int J Mol Sci. .

Abstract

Cancer-associated fibroblasts (CAFs), a prominent population of stromal cells, play a crucial role in tumor progression, prognosis, and treatment response. However, the relationship among CAF-based molecular signatures, clinical outcomes, and tumor microenvironment infiltration remains largely elusive in pancreatic cancer (PC). Here, we collected multicenter PC data and performed integrated analysis to investigate the role of CAF-related genes (CRGs) in PC. Firstly, we demonstrated that α-SMA+ CAFs were the most prominent stromal components and correlated with the poor survival rates of PC patients in our tissue microarrays. Then, we discriminated two diverse molecular subtypes (CAF clusters A and B) and revealed the significant differences in the tumor immune microenvironment (TME), four reported CAF subpopulations, clinical characteristics, and prognosis in PC samples. Furthermore, we analyzed their association with the immunotherapy response of PC patients. Lastly, a CRG score was constructed to predict prognosis, immunotherapy responses, and chemosensitivity in pancreatic cancer patients. In summary, these findings provide insights into further research targeting CAFs and their TME, and they pave a new road for the prognosis evaluation and individualized treatment of PC patients.

Keywords: cancer-associated fibroblasts; molecular signature; pancreatic cancer; therapeutic sensitivity; tumor immune microenvironment.


Conflict of interest statement

The authors declare that the research was conducted in the absence of any commercial or financial relationships that could be interpreted as a potential conflict of interest.

Figures

Figure 1
Figure 1
Pancreatic cancer (PC) tissues accumulating α-smooth muscle actin (α-SMA)-positive cancer-associated fibroblasts (CAFs) show a poor prognosis. (AC) Detection of α-SMA and EpCAM using double immunofluorescence to differentiate CAFs and epithelial cell populations in human PC tissue microarrays. (D) Representative images of α-SMA immunohistochemistry staining in human PC tissue microarray. (E) Representative Masson staining in human PC tissues. Blue color: stroma. (F) Human PC tissues were classified into α-SMA-high or α-SMA-low CAF groups on the basis of α-SMA immunohistochemistry score, followed by examining patients’ overall survival using Kaplan–Meier survival analysis by log-rank test. (G,H) The t-SNE plot of CAFs (CD45EpCAMCD29+), tumor cells (CD45CD29EpCAM+), and tissue leukocytes (CD29EpCAMCD45+) were measured by flow cytometry in human PC tissues. (I,J) The t-SNE plot of CAFs (CD45EpCAMPDPN+), tumor cells (CD45PDPNEPCAM+), and tissue leukocytes (PDPNEpCAMCD45+) were measured by flow cytometry in mouse-derived allograft tissues.
Figure 2
Figure 2
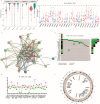
Genetic and transcriptional alterations of CAF-related genes (CRGs) in PC. (A) The enrichment scores of four CAF subsets between normal and PC tissues. (B) Expression distributions of 25 CRGs between normal and PC tissues from GTEx and TCGA cohorts. (C) The protein–protein interaction network acquired from the STRING database among the CRGs. (D) Mutation frequencies of CRGs in 158 PC patients from TCGA cohort. (E) Frequencies of copy number variation (CNV) gain, loss, and non-CNV among CRGs, pink and green represent gain and loss of CNV, respectively. (F) Locations of CNV alterations in CRGs on 23 chromosomes. *** p < 0.001 and not significant (p > 0.05) according to repeated-measures Wilcoxon test.
Figure 3
Figure 3
Identification of CAF subtypes and characteristics of the TME in PC. (A) Consensus matrix heatmap defining two clusters (k = 2) and their correlation area. (B) Kaplan–Meier plot of overall survival (OS) by CAF clusters for PC patients in TCGA cohort (p = 0.003, log-rank test). (C) Box plots showing CAF enrichment score between CAF cluster A and CAF cluster B. (D) A network of correlations including CRGs in TCGA cohort. (E) Differences in clinical features and expression levels of CRGs between the two distinct subtypes. Stage, gender, age, survival status, and cluster were used as patient annotations. (F) The enrichment score of four CAF subsets between CAF cluster A and CAF cluster B. (G) Correlations between the two CAF clusters and TME score. (H) The infiltration abundance of 33 TME cells of two CAF subtypes in PC. The Wilcoxon test analyzed the statistical differences between the two clusters (*** p < 0.001, ** p < 0.01, * p < 0.05, and not significant (p > 0.05)).
Figure 4
Figure 4
Establishment of the CRG score in TCGA cohort. (A) Alluvial diagram of subtype distributions in groups with distinct CRG score and survival status. (B) CRG score was significantly elevated in patients who died during follow-up. (C) Box plots displaying discrepancies in CRG scores between the two CAF subtypes. (D,G) Ranked dot and scatter plots showing the CRG score distribution and survival outcomes. Red and blue represent dead and alive of PC patients, respectively. (E) Kaplan–Meier plot of overall survival of patients with high and low CRG scores (p < 0.001, log-rank test). (F) Receiver operating characteristic curves to predict the sensitivity and specificity of 1-, 2-, and 3-year survival according to the CRG score. (H) Time-dependent receiver operating characteristic curves of the nomograms compared for 1-, 2-, and 3-year OS in PC, respectively. (I) Multivariate Cox regression analysis demonstrated that CRG score was the most critical risk factor for OS in PC among clinical factors.
Figure 5
Figure 5
Association of CRG scores with the immune microenvironment. (A) Correlations between the CRG score and immune infiltration. (B) GSVA performed in CRG score signature based on TCGA. (C) The infiltration abundance of 22 TME cells of two CRG-score groups in PC. (D) The enrichment score of four CAF subsets between the low-CRG-score group and the high-CRG-score group. (E) tROC analysis showed that the GRC score was an accurate variable for survival prediction. The Wilcoxon test analyzed the statistical differences between the two clusters (** p < 0.01 and not significant (* p > 0.05)).
Figure 6
Figure 6
Relationships among the CRG score, tumor mutation, and therapeutic susceptibility in PC. (A,B) Waterfall plot of somatic mutation properties according to low and high CRG scores. (C) TMB in diverse CRG-score groups. (D) The proportion of worse clinical outcomes after surgery is increased in the higher-CRG-score group. (E) The proportion of clinical outcomes in PC patients with high and low CRG scores after surgery. (F,G) Chemotherapeutic sensitivity for PC patients in low-CRG-score group. (H,I) Chemotherapeutic sensitivity for PC patients in high-CRG-score group. PR, partial response; PD, progressive disease; SD, stable disease; CR, complete response. The chi-square test was used to analyze the statistical differences between the two groups.
Figure 7
Figure 7
Immunohistochemical results of risk CRG expressions with their influences on OS. (A,B) The protein expression and survival of VCAN. (C,D) The protein expression and survival of SPARC. (E,F) The protein expression and survival of FNDC1. (G,H) The protein expression and survival of COL1A2.

References

    1. Helms E., Onate M.K., Sherman M.H. Fibroblast Heterogeneity in the Pancreatic Tumor Microenvironment. Cancer Discov. 2020;10:648–656. doi: 10.1158/2159-8290.CD-19-1353. - DOI - PMC - PubMed
    1. Neuzillet C., Tijeras-Raballand A., Ragulan C., Cros J., Patil Y., Martinet M., Erkan M., Kleeff J., Wilson J., Apte M., et al. Inter- and intra-tumoural heterogeneity in cancer-associated fibroblasts of human pancreatic ductal adenocarcinoma. J. Pathol. 2019;248:51–65. doi: 10.1002/path.5224. - DOI - PMC - PubMed
    1. Erez N., Truitt M., Olson P., Hanahan D. Cancer-Associated Fibroblasts Are Activated in Incipient Neoplasia to Orchestrate Tumor-Promoting Inflammation in an NF-kappa B-Dependent Manner. Cancer Cell. 2010;17:135–147. doi: 10.1016/j.ccr.2009.12.041. - DOI - PubMed
    1. Fearon D.T. The Carcinoma-Associated Fibroblast Expressing Fibroblast Activation Protein and Escape from Immune Surveillance. Cancer Immunol. Res. 2014;2:187–193. doi: 10.1158/2326-6066.CIR-14-0002. - DOI - PubMed
    1. Whittle M.C., Hingorani S.R. Fibroblasts in Pancreatic Ductal Adenocarcinoma: Biological Mechanisms and Therapeutic Targets. Gastroenterology. 2019;156:2085–2096. doi: 10.1053/j.gastro.2018.12.044. - DOI - PMC - PubMed

Publication types

MeSH terms