Meta-Analysis
. 2022 Dec 22;24(1):216.
doi: 10.3390/ijms24010216.

A Meta-Analysis Study of SOD1-Mutant Mouse Models of ALS to Analyse the Determinants of Disease Onset and Progression

Affiliations
Meta-Analysis

A Meta-Analysis Study of SOD1-Mutant Mouse Models of ALS to Analyse the Determinants of Disease Onset and Progression

Maria Ciuro et al. Int J Mol Sci. .

Abstract

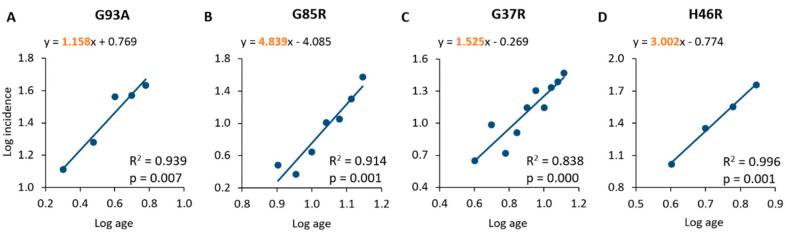
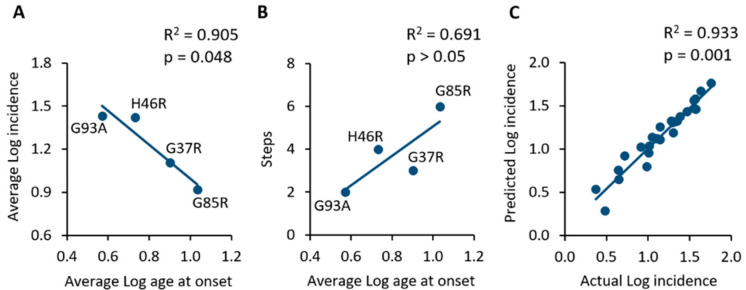
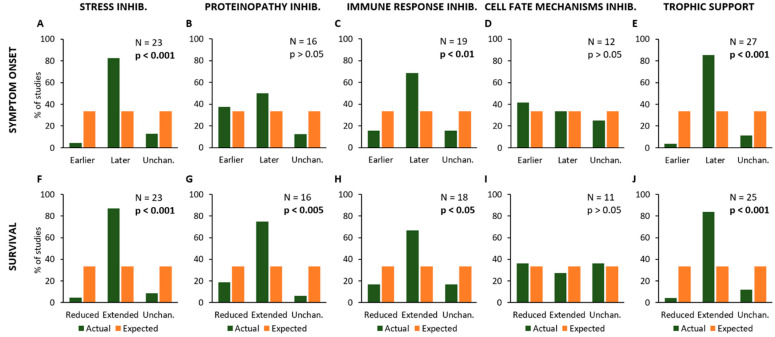
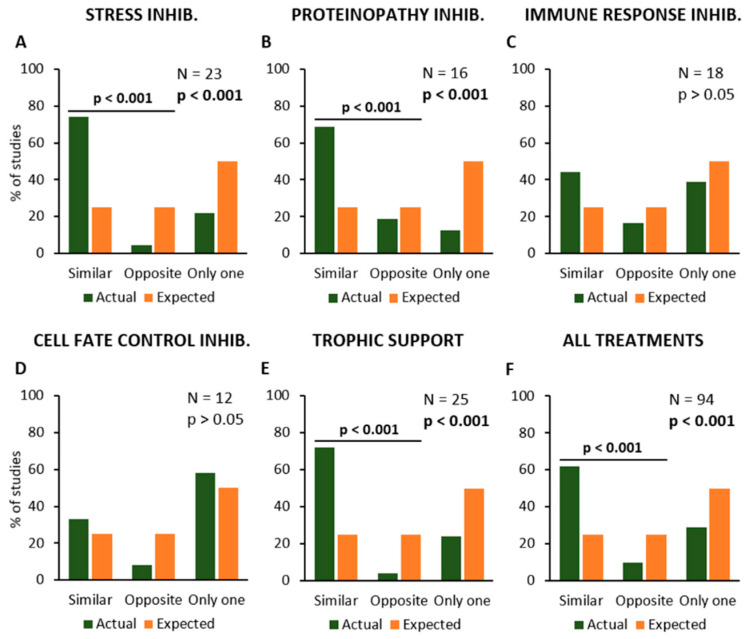
A complex interaction between genetic and external factors determines the development of amyotrophic lateral sclerosis (ALS). Epidemiological studies on large patient cohorts have suggested that ALS is a multi-step disease, as symptom onset occurs only after exposure to a sequence of risk factors. Although the exact nature of these determinants remains to be clarified, it seems clear that: (i) genetic mutations may be responsible for one or more of these steps; (ii) other risk factors are probably linked to environment and/or to lifestyle, and (iii) compensatory plastic changes taking place during the ALS etiopathogenesis probably affect the timing of onset and progression of disease. Current knowledge on ALS mechanisms and therapeutic targets, derives mainly from studies involving superoxide dismutase 1 (SOD1) transgenic mice; therefore, it would be fundamental to verify whether a multi-step disease concept can also be applied to these animal models. With this aim, a meta-analysis study has been performed using a collection of primary studies (n = 137), selected according to the following criteria: (1) the studies should employ SOD1 transgenic mice; (2) the studies should entail the presence of a disease-modifying experimental manipulation; (3) the studies should make use of Kaplan-Meier plots showing the distribution of symptom onset and lifespan. Then, using a subset of this study collection (n = 94), the effects of treatments on key molecular mechanisms, as well as on the onset and progression of disease have been analysed in a large population of mice. The results are consistent with a multi-step etiopathogenesis of disease in ALS mice (including two to six steps, depending on the particular SOD1 mutation), closely resembling that observed in patient cohorts, and revealed an interesting relationship between molecular mechanisms and disease manifestation. Thus, SOD1 mouse models may be considered of high predictive value to understand the determinants of disease onset and progression, as well as to identify targets for therapeutic interventions.

Keywords: ALS epidemiology; ALS pathogenesis; amyotrophic lateral sclerosis; mathematical model; meta-analysis; mouse; superoxide dismutase 1; symptom onset.


Conflict of interest statement

The authors declare no conflict of interest.

Figures

Figure 1
Figure 1
Linear regression and correlation of log age and log incidence in mouse populations of SOD1G93A (A), SOD1G85R (B), SOD1G37R (C) and SOD1H46R (D). The equations of the lines representing the best fit of linear regression are shown in the graphs. The slopes are highlighted in orange.
Figure 2
Figure 2
(A) Comparison of SOD1 mutant mouse populations showing an inverse correlation between the average age at onset and the average incidence in the same population. (B) The application of the Armitage and Doll model suggests that the lower the number of steps towards onset, the earlier the average age at onset of animals. (C) Linear regression and correlation of the actual incidence values extracted from primary studies and those predicted by the mathematical model. The strong correlation suggests the high predictability of the model.
Figure 3
Figure 3
Frequency distribution of the effects of different treatments or experimental manipulations on the onset of symptoms (AE) and survival time (FJ). The graphs show the percent number of studies where a given kind of treatment or manipulation is associated with a modification of onset and/or animal lifespan (in green), compared to the expected values (null hypothesis, in orange). In particular, the modifications of onset (anticipation or delay) and survival time (reduction or extension) are shown in relation to the treatments aiming at reducing Stress (A,F), Proteinopathy (B,G), Immune Response (C,H) and Cell Fate control (D,I), or providing Trophic Support (E,J). Each graph shows the total number of studies where a given kind of treatment/manipulation has been evaluated and the p-value calculated by using the Chi-square statistical test, representing the probability of null hypothesis when comparing the actual values to the expected ones.
Figure 4
Figure 4
Frequency distribution of the primary studies showing similar or opposite modification of symptom onset and survival time, or the modification of only one parameter, in response to the different types of treatment or experimental manipulation. Percent number of studies where the effect was observed (in green), are compared to the expected values (null hypothesis, in orange). The modifications of onset (anticipation or delay) and survival time (reduction or extension) are shown in relation to the inhibition of Stress (A), Proteinopathy (B), Immune Response (C) and Cell Fate Control mechanisms (D), and stimulation of Trophic Support (E). The average effects of all treatments together are shown in (F). Each graph shows the total number of studies where the effects of a given kind of treatment or manipulation has been evaluated and the p-value calculated by using the Chi-square statistical test. The horizontal bars and the relative p-values are relative to a Chi-square test comparing similar and opposite effects, with the exclusion of studies reporting effects on only one parameter (onset or survival).
Figure 5
Figure 5
Frequency distribution of the primary studies showing the association between treatments and the mechanisms they can modify. In particular, the most frequent types of mechanism, i.e., Immune Response (A) and Neuromuscular Degeneration (B) have been considered. Percent number of experiments showing the modification of one of these mechanisms (in blue) are compared to the expected values (null hypothesis, in orange). Each graph shows the total number of experiments analysing a particular mechanism, and the p-value calculated by using the Chi-square statistical test.

References

    1. Chiò A., Logroscino G., Hardiman O., Swingler R., Mitchell D., Beghi E., Traynor B.G. Prognostic factors in ALS: A critical review. Amiotroph. Lateral Scler. 2009;10:310–323. doi: 10.3109/17482960802566824. - DOI - PMC - PubMed
    1. Vucic S., Rothstein J.D., Kiernan M.C. Advances in treating amyotrophic lateral sclerosis: Insights from pathophysiological studies. Trends Neurosci. 2014;37:433–442. doi: 10.1016/j.tins.2014.05.006. - DOI - PubMed
    1. Feldman E.L., Goutman S.A., Petri S., Mazzini L., Savelieff M.G., Shaw P.J., Sobue G. Amyotrophic lateral sclerosis. Lancet. 2022;400:1363–1380. doi: 10.1016/S0140-6736(22)01272-7. - DOI - PMC - PubMed
    1. Sever B., Ciftci H., DeMirci H., Sever H., Ocak F., Yulug B., Tateishi H., Tateishi T., Otsuka M., Fujita M., et al. Comprehensive research on past and future therapeutic strategies devoted to treatment of amyotrophic lateral sclerosis. Int. J. Mol. Sci. 2022;23:2400. doi: 10.3390/ijms23052400. - DOI - PMC - PubMed
    1. Loscalzo J., Barabási A.-L., Silverman E.K. Network Medicine: Complex Systems in Human Disease and Therapeutics. Harvard University Press; Cambridge, MA, USA: 2017.

Publication types

Substances