. 2022 Dec 23;24(1):222.
doi: 10.3390/ijms24010222.

A Multi-Year, Multi-Cultivar Approach to Differential Expression Analysis of High- and Low-Protein Soybean (Glycine max)

Affiliations

A Multi-Year, Multi-Cultivar Approach to Differential Expression Analysis of High- and Low-Protein Soybean (Glycine max)

Julia C Hooker et al. Int J Mol Sci. .

Abstract

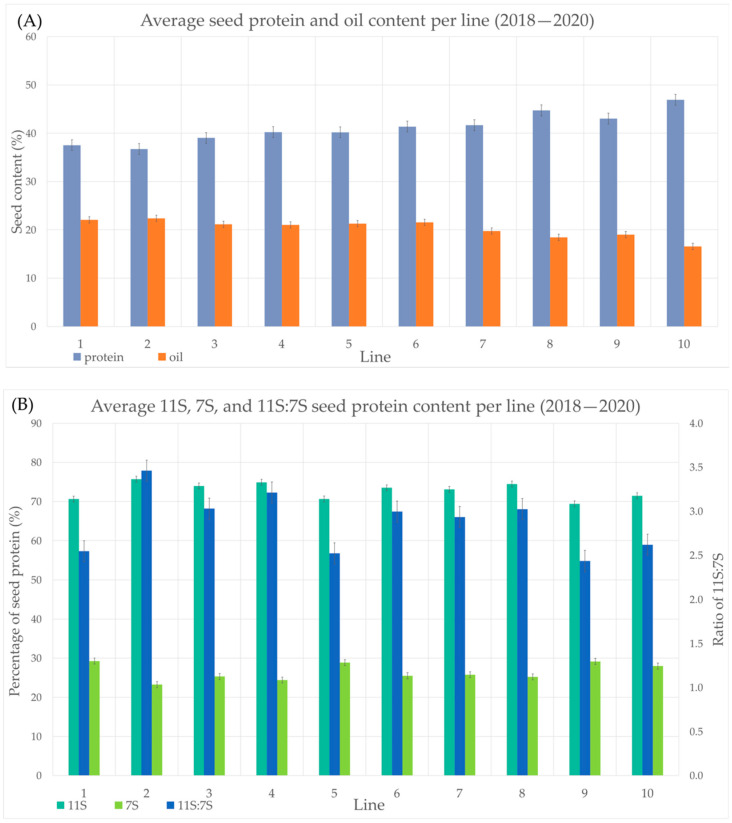
Soybean (Glycine max (L.) Merr.) is among the most valuable crops based on its nutritious seed protein and oil. Protein quality, evaluated as the ratio of glycinin (11S) to β-conglycinin (7S), can play a role in food and feed quality. To help uncover the underlying differences between high and low protein soybean varieties, we performed differential expression analysis on high and low total protein soybean varieties and high and low 11S soybean varieties grown in four locations across Eastern and Western Canada over three years (2018-2020). Simultaneously, ten individual differential expression datasets for high vs. low total protein soybeans and ten individual differential expression datasets for high vs. low 11S soybeans were assessed, for a total of 20 datasets. The top 15 most upregulated and the 15 most downregulated genes were extracted from each differential expression dataset and cross-examination was conducted to create shortlists of the most consistently differentially expressed genes. Shortlisted genes were assessed for gene ontology to gain a global appreciation of the commonly differentially expressed genes. Genes with roles in the lipid metabolic pathway and carbohydrate metabolic pathway were differentially expressed in high total protein and high 11S soybeans in comparison to their low total protein and low 11S counterparts. Expression differences were consistent between East and West locations with the exception of one, Glyma.03G054100. These data are important for uncovering the genes and biological pathways responsible for the difference in seed protein between high and low total protein or 11S cultivars.

Keywords: Glycine max; conglycinin (7S); differential gene expression; glycinin (11S); seed protein content; transcriptome-wide analysis.


Conflict of interest statement

The authors declare no conflict of interest.

Figures

Figure 1
Figure 1
Seed composition across each variety from 2018–2020. (A) Average TP and seed oil content as a percentage of the seed weight. (B) Average 11S and 7S protein content as a percentage of total seed protein (primary y axis) and the average 11S:7S ratio (secondary y axis). Error bars indicate the least squares difference per series.
Figure 2
Figure 2
PC analysis of normalized RNA-seq expression data for samples included in each individual DE analysis across the four locations and three years. Each TP year-location dataset is represented: (A) Ottawa 2018, (B) Ottawa 2019, (C) Ottawa 2020, (D) Morden 2018, (E) Morden 2019, (F) Morden 2020, (G) Brandon 2018, (H) Brandon 2019, (I) Saskatoon 2019, (J) Saskatoon 2020. Orange datapoints represent high TP samples, blue datapoints represent low TP samples. No data collected from Saskatoon 2018 and Brandon 2020. The line number (1, 2, 3, 8, 9, 10) for each corresponding datapoint is indicated.
Figure 3
Figure 3
PC analysis of normalized RNA-seq expression data for samples included in each individual DE analysis across the four locations and three years. Each 11S year-location dataset is represented: (A) Ottawa 2018, (B) Ottawa 2019, (C) Ottawa 2020, (D) Morden 2018, (E) Morden 2019, (F) Morden 2020, (G) Brandon 2018, (H) Brandon 2019, (I) Saskatoon 2019, (J) Saskatoon 2020. Orange datapoints represent high 11S samples, blue datapoints represent low 11S samples. No data for Saskatoon 2018 and Brandon 2020. The line number (1, 2, 4, 5, 8, 9) for each corresponding datapoint is indicated.
Figure 4
Figure 4
Expression heatmaps for shortlisted genes differentially expressed in high TP soybeans (lines 8, 9, 10 vs. lines 1, 2, 3) for each year-location analysis. Each TP year-location dataset is represented: (A) Ottawa 2018, (B) Ottawa 2019, (C) Ottawa 2020, (D) Morden 2018, (E) Morden 2019, (F) Morden 2020, (G) Brandon 2018, (H) Brandon 2019, (I) Saskatoon 2019, (J) Saskatoon 2020. Upregulation is indicated by shades of yellow, downregulation is indicated by shades of blue. Grey indicates that a gene was not differentially expressed between high and low TP soybeans at an adjusted p-value < 0.05. The legend at the bottom left provides the gene identities and their correspondence with the numbers on the right y-axis of the heatmaps.
Figure 5
Figure 5
Expression heatmaps for shortlisted genes differentially expressed in high 11S soybeans (lines 2, 4, 8 vs. lines 1, 5, 9) for each year-location analysis. Each 11S year-location dataset is represented: (A) Ottawa 2018, (B) Ottawa 2019, (C) Ottawa 2020, (D) Morden 2018, (E) Morden 2019, (F) Morden 2020, (G) Brandon 2018, (H) Brandon 2019, (I) Saskatoon 2019, (J) Saskatoon 2020. Upregulation is indicated by shades of yellow, downregulation is indicated by shades of blue. Grey indicates that a gene was not differentially expressed between high and low 11S soybeans at an adjusted p-value < 0.05. The legend at the bottom left provides the gene identities and their correspond with the numbers on the right y-axis of the heatmaps.
Figure 6
Figure 6
Revigo plots summarizing the relationships between the most indispensable biological process (BP) gene ontologies (GOs) for upregulated (A) and downregulated (B) shortlist genes across the high vs. low TP DE analyses. Circle size represents logSize value, higher logSize values indicate a strong presence of a term and/or its daughter terms; more general terms have larger bubbles. Color represents significance of a term among the query set of GOs.
Figure 7
Figure 7
Revigo plots summarizing the relationships between the most indispensable BP GO terms for the upregulated (A) and downregulated (B) shortlist genes across the high vs. low 11S DE analyses. Circle size represents logSize value, higher logSize values indicate a strong presence of a term and/or its daughter terms; more general terms have larger bubbles. Color represents significance of a term among the query set of GOs.

References

    1. Tilman D., Balzer C., Hill J., Befort B.L. Global Food Demand and the Sustainable Intensification of Agriculture. Proc. Natl. Acad. Sci. USA. 2011;108:20260–20264. doi: 10.1073/pnas.1116437108. - DOI - PMC - PubMed
    1. Sprent J.I., Sprent P. In: Nitrogen Fixing Organisms. 1st ed. Sprent J.I., editor. Springer; Dordrecht, The Netherlands: 1990.
    1. Snyder C.S., Bruulsema T.W., Jensen T.L., Fixen P.E. Review of Greenhouse Gas Emissions from Crop Production Systems and Fertilizer Management Effects. Agric. Ecosyst. Environ. 2009;133:247–266. doi: 10.1016/j.agee.2009.04.021. - DOI
    1. Ma Y., Kan G., Zhang X., Wang Y., Zhang W., Du H., Yu D. Quantitative Trait Loci (QTL) Mapping for Glycinin and β-Conglycinin Contents in Soybean (Glycine Max L. Merr.) J. Agric. Food Chem. 2016;64:3473–3483. doi: 10.1021/acs.jafc.6b00167. - DOI - PubMed
    1. Yamada T., Mori Y., Yasue K., Maruyama N., Kitamura K., Abe J. Knockdown of the 7S Globulin Subunits Shifts Distribution of Nitrogen Sources to the Residual Protein Fraction in Transgenic Soybean Seeds. Plant Cell Rep. 2014;33:1963–1976. doi: 10.1007/s00299-014-1671-y. - DOI - PubMed

Substances

LinkOut - more resources