. 2022 Dec 23;24(1):226.
doi: 10.3390/ijms24010226.

Near-Infrared 810 nm Light Affects Porifera Chondrosia reniformis (Nardo, 1847) Regeneration: Molecular Implications and Evolutionary Considerations of Photobiomodulation-Animal Cell Interaction

Affiliations

Near-Infrared 810 nm Light Affects Porifera Chondrosia reniformis (Nardo, 1847) Regeneration: Molecular Implications and Evolutionary Considerations of Photobiomodulation-Animal Cell Interaction

Andrea Amaroli et al. Int J Mol Sci. .

Abstract

Chemotrophic choice as a metabolic source of energy has characterised animal cell evolution. However, light interactions with animal cell photoacceptors that are able to increase energetic metabolism (photo-biomodulation (PBM)) have been previously described. In the present study, we cut three specimens of Chondrosia reniformis into four equal parts (12 fragments), and we irradiated the regenerating edge of six fragments with the previously characterised 810 nm near-infrared light, delivered at 1 W, 60 J/cm2, 1 W/cm2, and 60 J in a continuous-wave mode for 60 s through a flat-top hand-piece with a rounded spot-size area of 1 cm2. Six fragments were irradiated with 0 W for 60 s as the controls. We performed irradiation at the time 0 h and every 24 h for a total of five administrations. We monitored the regeneration process for five days (120 h) in aquaria by examining the macroscopic and histological changes. We analysed the gene expression profile of the inflammatory processes, apoptosis, heat stress, growth factors, and collagen production and determined oxidative stress enzyme activity and the total prokaryotic symbiont content. PBM sped up C. reniformis regeneration when compared to the controls. Particularly, transforming growth factor TGF3 and TGF6 upregulation during the early phase of regeneration and TGF5 upregulation 120 h postinjury in the irradiated samples supports the positive effect of PBM in sponge tissue recovery. Conversely, the expression of TGF4, a sponge fibroblast growth factor homologue, was not affected by irradiation, indicating that multiple, independent pathways regulate the TGF genes. The results are consistent with our previous data on a wide range of organisms and humans, suggesting that PBM interaction with primary and secondary cell targets has been conserved through the evolution of life forms.

Keywords: Porifera; Wnt; collagen; evolution; heat shock protein; inflammation; light therapy; low-level laser therapy; tissue regeneration; transforming growth factor; tumour necrosis factor.


Conflict of interest statement

The authors declare no conflict of interest.

Figures

Figure 1
Figure 1
Effect of photo-biomodulation (PBM) on Chondrosia reniformis morphology during tissue regeneration. The regeneration profile of two C. reniformis specimens immediately (0 h) and 24, 72, and 120 h after being cut into four parts, daily irradiated on the regenerating edge with 810 nm-1 W PBM. PBM = samples irradiated with 810 nm-1 W PBM; control = samples irradiated with 810 nm-0 W PBM. Scale bars are 1 cm. The centre of the irradiated area is indicated by the red asterisk.
Figure 2
Figure 2
Histological sections showing the regenerating edges of Chondrosia reniformis fragments 24 h after being cut. The (A) control (810 nm-0 W photo-biomodulation [PBM]) and (B) irradiated (810 nm-1 W PBM) fragments were stained with Masson’s trichrome. Some spherulous cells (arrows) and exopinacocyte-like cells (arrowheads) are visible on the regenerating edge. The scale bars are 50 µm.
Figure 3
Figure 3
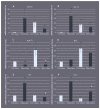
Histological sections showing the regenerating edges of Chondrosia reniformis fragments 24 h after being cut. Immunofluorescence of the (A) control (810 nm-0 W photo-biomodulation [PBM]) and (B) irradiated (810 nm-1 W PBM) fragments stained for Msi-1 (red) and DAPI (blue). Archaeocytes are scattered in the sponge tissue (arrows). The scale bars are 50 µm. (C) Semiquantitative Msi-1 immunofluorescence analysis: the percentage of red fluorescence pixels on total tissue-occupied pixels. Student’s t-test, p < 0.001 (*). CTR = control. Each bar represents the mean ± standard deviation of three independent experiments performed in triplicate. The negative control is shown in Figure S1.
Figure 4
Figure 4
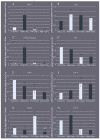
The effect of photo-biomodulation (PBM) on the expression of genes related to thermal stress, inflammation, and apoptosis. The real-time PCR gene expression analysis of (A) heat shock protein 60 (HSP60), (B) HSP70, (C) HSP90, (D) nitric oxide synthase (NOS), (E) tumour necrosis factor (TNF), and (F) Bcl-2 (F) in regenerating Chondrosia reniformis tissue 24 h (PBM-24 h) or 120 h (PBM-120 h) after PBM. The control groups (CTR-24 h and CTR-120 h) are the respective 810 nm-0 W PBM nonirradiated samples (0 J). The data are expressed as the messenger RNA (mRNA) fold-increase relative to the CTR-24 h sample and are normalised to GAPDH expression. Each bar represents the mean ± standard deviation of the three independent experiments performed in triplicate. The data were analysed with one-way analysis of variance (ANOVA) followed by Tukey’s test (ANOVA p-values: (A) p = 0.013071; (B) p = 0.001023; (C) p = 0.000511; (D) p = 0.003392; (E) p = 0.000192; (F) p = 0.000014). The asterisks indicate significant differences between groups based on Tukey’s test versus CTR-24hrs; * p < 0.05; ** p < 0.01. The hash symbol indicates significant differences between groups based on Tukey’s test versus CTR-120 hrs, # p < 0.05.
Figure 5
Figure 5
Effect of photo-biomodulation (PBM) on the expression of proliferation/differentiation, extracellular matrix synthesis, and growth factor genes. The real-time PCR gene expression quantification of (A) the pluripotent stem cell-inducer gene Musashi 1 (Msi-1); (B) the endogenous wingless protein (Wnt) signalling pathway; (C) fibrillar collagen; (D) fibroblast growth factor (FGF), and (E) transforming growth factor 3 (TGF3), (F) TGF4, (G) TGF5, and (H) TGF6 (H) in regenerating Chondrosia reniformis tissue 24 h (PBM-24 h) and 120 h (PBM-120 h) after PBM. The control groups (CTR-24 h and CTR-120 h) are the respective 810 nm-0 W PBM nonirradiated samples (0 J). The data are expressed as the messenger RNA (mRNA)-fold increase relative to CTR-24 h and are normalised to GAPDH expression. Each bar represents the mean ± standard deviation of three independent experiments performed in triplicate. The data were analysed with one-way analysis of variance (ANOVA) followed by Tukey’s test (ANOVA p-values: (A), p = 0.013071; (B), p = 0.001023; (C), p = 0.000511; (D), p = 0.003392; (E), p = 0.000192; (F), p = 0.000014). The asterisks indicate significant differences between the groups based on Tukey’s test versus CTR-24 h, * p < 0.05, ** p < 0.01. The hash symbol indicates significant differences between groups based on Tukey’s test versus CTR-120 h, ## p < 0.01.
Figure 6
Figure 6
Prokaryotic symbiont DNA quantification. Analysis of the sponge prokaryotic symbiont population based on real-time PCR DNA quantification in the regenerating Chondrosia reniformis specimens 24 h postinjury and the first dose of 810 nm-1 W photo-biomodulation (PBM-24 h) and 120 h postinjury (PBM-120 h). The control groups (CTR-24 h and CTR-120 h) are the respective non-irradiated samples. The data are expressed as the prokaryotic DNA gene copy number relative to CTR-24 h and are normalised to the GAPDH gene copy number. Each bar represents the mean ± standard deviation of the three independent experiments performed in triplicate. The data were analysed with a one-way analysis of variance (ANOVA) followed by Tukey’s test (ANOVA p = 0.006047). The asterisks indicate a significant difference between groups based on Tukey’s test (versus CTR-24 h, * p < 0.05).
Figure 7
Figure 7
Summary of the experimental design used in the study. (A) Three Chondrosia reniformis were cut into four fragments (a1, a2, a3, and a4; b1, b2, b3, and b4; c1, c2, c3, and c4). A total of 12 fragments were obtained and were equally subdivided into two groups. (B) Six fragments (a1, a2; b1, b2; c1, c2) were irradiated with 810 nm-0 W, 0 J (control), and six fragments (a3, a4; b3, b4; c3, c4) were exposed to 810 nm-1 W PBM. Irradiation was performed daily for five days, and the specimens were analysed for gene expression, prokaryotic DNA analysis, and histology. (C) Three C. reniformis were cut into four fragments (d1, d2, d3, and d4; e1, e2, e3, and e4; f1, f2, f3, and f4). A total of 12 fragments were obtained, and six of these were equally subdivided into two groups. Three fragments (d1, d2; e1, e2; f1, f2) were irradiated with 810 nm-0 W, 0 J (control), and three fragments (d3, d4; e3, e4; f3, f4) were exposed to 810 nm-1 W PBM. Irradiation was performed on the first day (0 h), and the specimens were collected after 6 h for oxidative stress analysis. Irradiations were performed with a flat-top hand-piece fixed to a stand 0.5 cm from the sample (B).
Figure 8
Figure 8
Outline of the PBM treatment parameters used.

References

    1. Trevors J.T. Origin of Life: Hypothesized Roles of High-Energy Electrical Discharges, Infrared Radiation, Thermosynthesis and Pre-Photosynthesis. Theory Biosci. 2012;131:225–229. doi: 10.1007/s12064-012-0157-0. - DOI - PubMed
    1. Ruban A.V. Evolution under the Sun: Optimizing Light Harvesting in Photosynthesis. J. Exp. Bot. 2015;66:7–23. doi: 10.1093/jxb/eru400. - DOI - PubMed
    1. Smol’yaninova N.K., Karu T.I., Fedoseeva G.E., Zelenin A.V. Effects of He-Ne Laser Irradiation on Chromatin Properties and Synthesis of Nucleic Acids in Human Peripheral Blood Lymphocytes. Biomed. Sci. 1991;2:121–126. - PubMed
    1. De Freitas L.F., Hamblin M.R. Proposed Mechanisms of Photobiomodulation or Low-Level Light Therapy. IEEE J. Sel. Top. Quantum Electron. 2016;22:348–364. doi: 10.1109/JSTQE.2016.2561201. - DOI - PMC - PubMed
    1. Rojas J.C., Gonzalez-Lima F. Low-Level Light Therapy of the Eye and Brain. Eye Brain. 2011;3:49. doi: 10.2147/EB.S21391. - DOI - PMC - PubMed

LinkOut - more resources