. 2022 Dec 23;24(1):240.
doi: 10.3390/ijms24010240.

Blockade of CB1 or Activation of CB2 Cannabinoid Receptors Is Differentially Efficacious in the Treatment of the Early Pathological Events in Streptozotocin-Induced Diabetic Rats

Affiliations

Blockade of CB1 or Activation of CB2 Cannabinoid Receptors Is Differentially Efficacious in the Treatment of the Early Pathological Events in Streptozotocin-Induced Diabetic Rats

Dimitris Spyridakos et al. Int J Mol Sci. .

Abstract

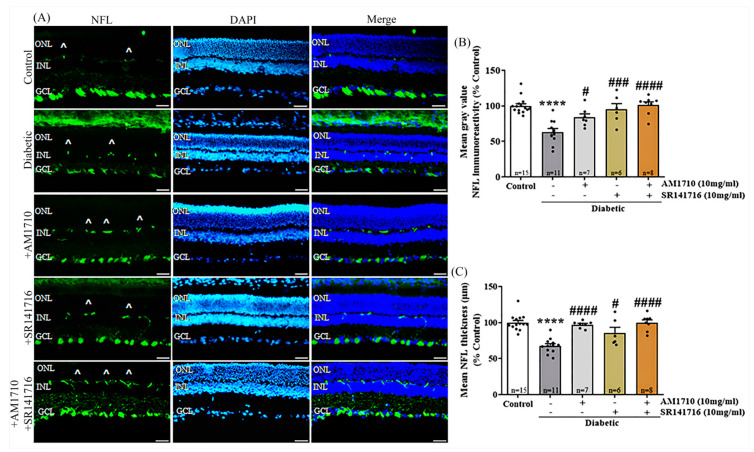
Oxidative stress, neurodegeneration, neuroinflammation, and vascular leakage are believed to play a key role in the early stage of diabetic retinopathy (ESDR). The aim of this study was to investigate the blockade of cannabinoid receptor 1 (CB1R) and activation of cannabinoid receptor 2 (CB2R) as putative therapeutics for the treatment of the early toxic events in DR. Diabetic rats [streptozotocin (STZ)-induced] were treated topically (20 μL, 10 mg/mL), once daily for fourteen days (early stage DR model), with SR141716 (CB1R antagonist), AM1710 (CB2R agonist), and the dual treatment SR141716/AM1710. Immunohistochemical-histological, ELISA, and Evans-Blue analyses were performed to assess the neuroprotective and vasculoprotective properties of the pharmacological treatments on diabetes-induced retinal toxicity. Activation of CB2R or blockade of CB1R, as well as the dual treatment, attenuated the nitrative stress induced by diabetes. Both single treatments protected neural elements (e.g., RGC axons) and reduced vascular leakage. AM1710 alone reversed all toxic insults. These findings provide new knowledge regarding the differential efficacies of the cannabinoids, when administered topically, in the treatment of ESDR. Cannabinoid neuroprotection of the diabetic retina in ESDR may prove therapeutic in delaying the development of the advanced stage of the disease.

Keywords: cannabinoid receptors; early stage diabetic retinopathy; endocannabinoid system; eye drops; neurodegeneration; neuroinflammation; neuroprotection; nitrative stress; vascular leakage.


Conflict of interest statement

The authors declare no conflict of interest.

Figures

Figure 1
Figure 1
Effect of cannabinoid treatment on ganglion cell axons in the diabetic retina. (A) Representative photomicrographs of NFL immunoreactivity (NFL-IR). Artifacts are depicted by the marker (^). Magnification: 20×. Scalebar: 50 μm. (B) Quantification studies of NFL-IR: Diabetes attenuated NFL-IR (**** p < 0.0001 compared to Control). Both AM1710 and SR141716 reversed the diabetes effect (AM1710; # p = 0.0403 compared to diabetic untreated, p > 0.05 compared to Control, and SR141716; ### p = 0.0008 compared to diabetic untreated, p > 0.05 compared to Control). The dual treatment with AM1710 + SR141716 displayed a similar action by restoring NFL-IR (#### p < 0.0001 compared to diabetic untreated, p > 0.05 compared to Control, p > 0.05 compared to AM1710 or SR141716. (C) Diabetes induced a significant decrease in NFL thickness (**** p < 0.0001 compared to Control). AM1710 and SR141716 reversed the diabetes effect (AM1710; #### p < 0.0001 compared to diabetic untreated, p > 0.05 compared to Control, and SR141716; # p = 0.0183 compared to diabetic untreated, p > 0.05 compared to Control). Dual treatment with AM1710 + SR141716 blocked the diabetes-induced reduction in NFL thickness (#### p < 0.0001 compared to diabetic untreated, p > 0.05 compared to Control p > 0.05 compared to AM1710 or SR141716). Data are expressed as mean ± S.D and presented in a form that combines a bar diagram and scatter dot plot, with every dot representing a different value. One-way ANOVA was employed for the statistical analysis of all data, followed by Tukey’s multiple comparison test. Differences were considered statistically significant when p < 0.05.
Figure 2
Figure 2
Effect of cannabinoid treatment in the thickness of retinal tissue. (A) Representative photomicrographs of H & E stained retinal tissue). Ganglion cells (black) are depicted with yellow arrows. Magnification 20×. Scalebar: 50 μm. (B) Quantification analysis of the whole retinal tissue thickness, measured from the retinal pigment epithelium (RPE) to the ganglion cell layer (GCL). Diabetes induced a significant reduction in the total thickness of the retina (**** p < 0.0001 compared to Control). Administration of AM1710 partially blocked the reduction in the thickness of the diabetic retina (* p = 0.0161 compared to Control, # p = 0.0271 compared to diabetic untreated). SR141716 displayed similar actions (p > 0.05 compared to Control, ## p = 0.0019 compared to diabetic untreated). (C) Quantitative analysis of the thickness of three separate nuclear retinal layers, outer nuclear layer (ONL), inner nuclear layer (INL), and GCL. Diabetes had no effect on the thickness of ONL (p > 0.05 compared to Control). INL: The thickness of INL in the diabetic retinas was significantly thinner compared to the retina of Control animals ** p = 0.0034 compared to Control). Treatment with either the CB2R agonist (AM1710; # p = 0.0244 compared to Diabetic untreated, p > 0.05 compared to Control) or CB1R antagonist (SR141716; # p = 0.0383 compared to diabetic untreated, p > 0.05 compared to Control), reversed this reduction of thickness. GCL: The thickness of GCL remained unaffected by diabetes (p > 0.05 compared to Control). (D) Quantitative analysis of the ganglion cell population in GCL. The number of ganglion cells in GCL remains unaltered by diabetes (p > 0.05 compared to Control). Data are expressed as mean ± S.D and presented in a form that combines a bar diagram and scatter dot plot, with every dot representing a different value. One-way ANOVA was employed for the statistical analysis of data on panels (B,D), followed by Tukey’s multiple comparison test. Two-way ANOVA was employed for the analysis of separate layers’ thickness on panel (C), followed by Sidak’s multiple comparison test. Differences were considered statistically significant when p < 0.05.
Figure 3
Figure 3
Effect of cannabinoid treatment on the nitric oxide synthetase (bNOS) expressing retinal amacrine cell viability in the diabetic retina. (A) Representative photomicrographs of bNOS immunoreactivity (bNOS-IR). White arrows indicate bNOS expressing retinal amacrine cells. Magnification: 40×. Scale bar: 50 μm. (B) Quantification of bNOS-IR: Diabetes attenuated in a statistically significant manner the number of bNOS expressing retinal amacrine cells, compared to Control animals (**** p < 0.0001 compared to Control). AM1710 reversed the diabetes effect (#### p < 0.0001 compared to diabetic untreated, p > 0.05 compared to Control). SR141716 had no effect (p > 0.05 compared to diabetic untreated, **** p < 0.0001 compared to Control, ++++ p < 0.0001 compared to AM1710). The dual treatment, AM1710+ SR141716, blocked diabetes-induced loss of bNOS+ cells (# p = 0.0192 compared to diabetic untreated, + p = 0.0388 compared to AM1710, +++ p = 0.0003 compared to SR141716). Data are expressed as mean ± S.D and presented in a form that combines a bar diagram and scatter dot plot, with every dot representing a different value. One-way ANOVA was employed for the statistical analysis of all data, followed by Tukey’s multiple comparison test. Differences were considered statistically significant when p < 0.05.
Figure 4
Figure 4
Effect of cannabinoid treatment on cl. caspase-3 dependent apoptosis in the diabetic retina. (A) Representative photomicrographs of cleaved caspase-3 immunoreactivity (cl. caspase 3-IR). Magnification: 20×. Scalebar: 50 μm. (B) Quantification studies of cl. caspase 3-IR: Diabetes induced an increase in apoptotic caspase 3+ cells in the INL of diabetic rats (*** p = 0.0004 compared to Control). AM1710 reversed the diabetes effect (## p = 0.0038 compared to diabetic untreated, p > 0.05 compared to Control). SR141716 (had no effect (p > 0.05 compared to diabetic untreated, * p = 0.0308 compared to Control, p > 0.05 compared to AM1710). Data are expressed as mean ± S.D and presented in a form that combines a bar diagram and scatter dot plot, with every dot representing a different value. One-way ANOVA was employed for the statistical analysis of all data, followed by Tukey’s multiple comparison test. Differences were considered statistically significant when p < 0.05.
Figure 5
Figure 5
Effect of cannabinoid treatment on Müller cell activation in the diabetic retina. (A) Representative photomicrographs of GFAP immunoreactivity (GFAP-IR). Magnification: 20×. Scalebar: 50 μm. (B) Quantification studies of GFAP IR. Diabetes increased reactive Müller cells (**** p < 0.0001 compared to Control). AM1710 restored GFAP-IR to Control levels (#### p < 0.0001 compared to diabetic untreated, p > 0.05 compared to Control). SR141716 did not affect the diabetes-induced upregulation in GFAP-IR (p > 0.05 compared to diabetic untreated, *** p = 0.0003 compared to Control, +++ p = 0.0008 compared to AM1710). Dual treatment with AM1710+ SR141716 failed to block the diabetes-induced increase in GFAP expression (p > 0.05 compared to diabetic untreated, **** p < 0.0001 compared to Control, ++++ p < 0.0001 compared to AM1710). Data are expressed as mean ± S.D and presented in a form that combines a bar diagram and scatter dot plot, with every dot representing a different value. One-way ANOVA was employed for the statistical analysis of all data, followed by Tukey’s multiple comparison test. Differences were considered statistically significant when p < 0.05.
Figure 6
Figure 6
Effect of cannabinoid treatment on macrophage (microglia) activation and pro-inflammatory cytokine (TNFα) release in the diabetic retina. (A) Representative photomicrographs of Iba1 immunoreactivity (Iba1-IR). White arrows indicate reactive microglial cells. Magnification: 20×. Scalebar: 50 μm. (B) Quantification studies of Iba1-IR: Diabetes increased in a statistically significant manner the number of reactive Iba1+ cells (*** p = 0.0004 compared to Control). AM1710 reduced Iba1+ activation (## p = 0.0010 compared to diabetic untreated, p > 0.05 compared to Control), while SR141716 had no statistically significant effect (p > 0.05 compared to diabetic untreated, p > 0.05 compared to Control, p > 0.05 compared to AM1710). Dual treatment with AM1710 + SR141716 had no effect on the number of reactive Iba1+ cells (p > 0.05 compared to diabetic untreated, ** p = 0.0047 compared to Control, + p = 0.0106 compared to AM1710, p > 0.05 compared to SR141716). (C) Quantitative analysis of TNFα levels Diabetes-induced upregulation in TNFα levels in the diabetic retinas (** p = 0.0055 compared to Control). AM1710 attenuated this diabetes effect (# p = 0.0290 compared to diabetic untreated, p > 0.05 compared to Control). No statistically significant effect on TNFα levels was observed by the SR141716 (p > 0.05 compared to diabetic untreated, p > 0.05 compared to Control). Data are expressed as mean ± S.D and presented in a form that combines a bar diagram and scatter dot plot, with every dot representing a different value. One-way ANOVA was employed for the statistical analysis of all data, followed by Tukey’s multiple comparison test. Differences were considered statistically significant when p < 0.05.
Figure 7
Figure 7
Effect of cannabinoid treatment on nitrative stress induced by diabetes in rat retina. (A) Representative photomicrographs of NT immunoreactivity (NT-IR). Magnification: 20×. Scalebar: 50 μm. (B) Quantification studies of NT-IR: Diabetes significantly increased the number of NT+ (**** p < 0.0001 compared to Control). eAM1710 reduced the number of NT+ cells in the diabetic retina (#### p < 0.0001 compared to diabetic untreated animals, * p = 0.0360 compared to Control), and SR141716 had a similar effect (### p = 0.0004 compared to diabetic untreated, **** p < 0.0001 compared to Control, p > 0.05 compared to AM1710). The dual treatment AM1710 + SR141716 reversed to Control levels the diabetes-induced increase in nitrative stress (#### p < 0.0001 compared to diabetic untreated, p > 0.05 compared to Control, + p = 0.0243 compared to AM1710, ++++ p = 0.0001 compared to SR14176). (C) Quantification studies of NT-IR in separate retinal layers. Diabetes increased NT-IR in RPE (** p < 0.0010), OPL (* p < 0.0161), INL (*** p < 0.0006), and GCL (* p < 0.0258) compared to Control. AM1710 reduced NT-IR in RPE (# p < 0.0177), OPL (# p < 0.0498), INL (# p < 0.0237), and GCL (# p < 0.0451) compared to diabetic untreated. SR141716 displayed a statistically significant effect in reducing NT-IR in GCL (# p < 0.0187). The dual treatment fully reversed elevated NT-IR in RPE (### p < 0.0002), OPL (## p < 0.0013), INL (## p < 0.0033), and GCL (## p < 0.0037), compared to diabetic untreated. Data are expressed as mean ± S.D and presented in a form that combines a bar diagram and scatter dot plot, with every dot representing a different value. One-way ANOVA was employed for the statistical analysis of data on panel (B), followed by Tukey’s multiple comparison test. Two-way ANOVA was employed for the analysis of separate layers’ NT-IR on panel (C), followed by Sidak’s multiple comparison test. Statistical significance, p < 0.05. Differences were considered statistically significant when p < 0.05.
Figure 8
Figure 8
Effect of cannabinoid treatment on diabetes-induced blood–retinal barrier leakage. (A) Co-localization of CD-31, NT, and the nuclear marker DAPI. Representative photomicrograph of a diabetic untreated retina, showing that NT is colocalized with CD-31 in blood vessels in the GCL. White arrow marks the co-localization area. Magnification: 20×. Scalebar: 50 μm. (B) Quantitative analysis of EB data: Diabetes induced an increase in BRB leakage (*** p = 0.0007 compared to Control). Treatment with either AM1710 (## p = 0.0021 compared to diabetic untreated, p > 0.05 compared to Control) or SR141716 (## p = 0.0048 compared to diabetic untreated, p > 0.05 compared to Control) blocked this effect. Data are expressed as mean ± S.D and presented in a form that combines a bar diagram and scatter dot plot, with every dot representing a different value. One-way ANOVA was employed for the statistical analysis of all data, followed by Tukey’s multiple comparison test. Differences were considered statistically significant when p < 0.05.

References

    1. Diabetic Retinopathy—Silently Blinding Millions of People World-Wide. IAPB Vision Atlas. [(accessed on 26 September 2002)]. Available online: http://atlas.iapb.org/vision-trends/diabetic-retinopathy/
    1. Simó R., Hernández C. New Insights into Treating Early and Advanced Stage Diabetic Retinopathy. Int. J. Mol. Sci. 2022;23:8513. doi: 10.3390/ijms23158513. - DOI - PMC - PubMed
    1. Metea M.R., Newman E.A. Signalling within the neurovascular unit in the mammalian retina. Exp. Physiol. 2007;92:635–640. doi: 10.1113/expphysiol.2006.036376. - DOI - PMC - PubMed
    1. Giacco F., Brownlee M. Oxidative stress and diabetic complications. Circ. Res. 2010;107:1058–1070. doi: 10.1161/CIRCRESAHA.110.223545. - DOI - PMC - PubMed
    1. Yu Z., Lu B., Sheng Y., Zhou L., Ji L., Wang Z. Andrographolide ameliorates diabetic retinopathy by inhibiting retinal angiogenesis and inflammation. Biochim. Biophys. Acta Gen. Subj. 2015;1850:824–831. doi: 10.1016/j.bbagen.2015.01.014. - DOI - PubMed

MeSH terms