. 2022 Dec 30;24(1):672.
doi: 10.3390/ijms24010672.

iTRAQ-Based Proteomic Analysis of APP Transgenic Mouse Urine Exosomes

Affiliations

iTRAQ-Based Proteomic Analysis of APP Transgenic Mouse Urine Exosomes

Xiaojing Zhou et al. Int J Mol Sci. .

Abstract

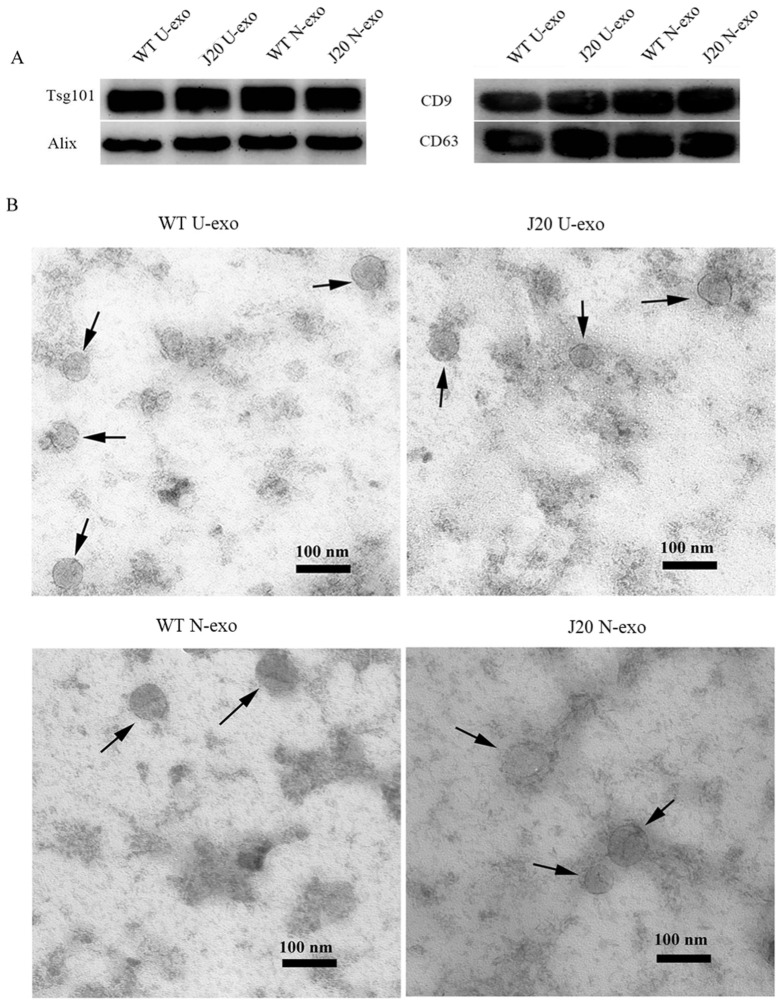
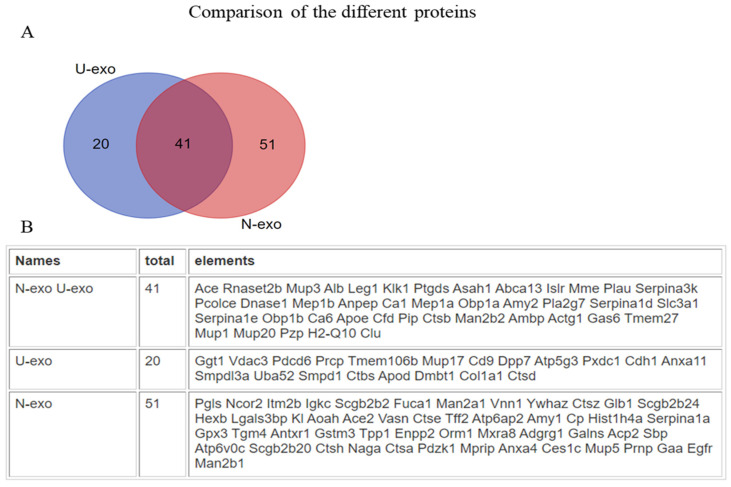
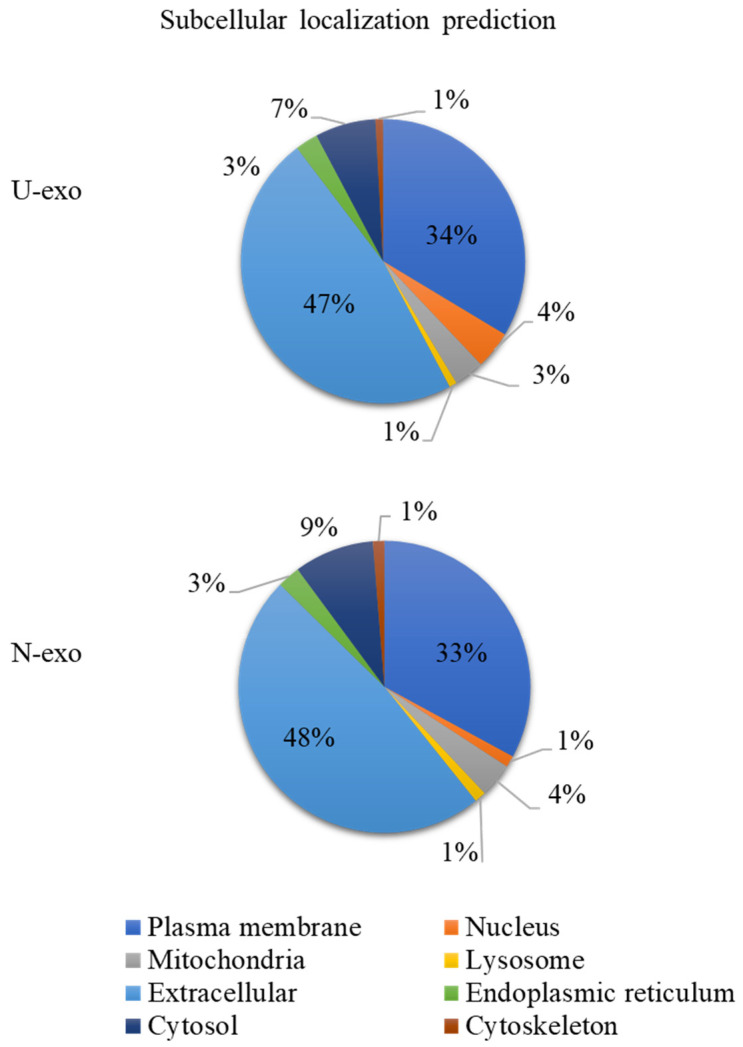
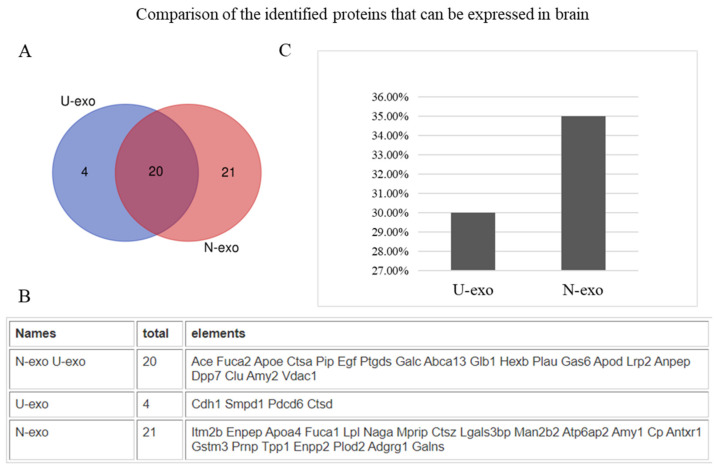
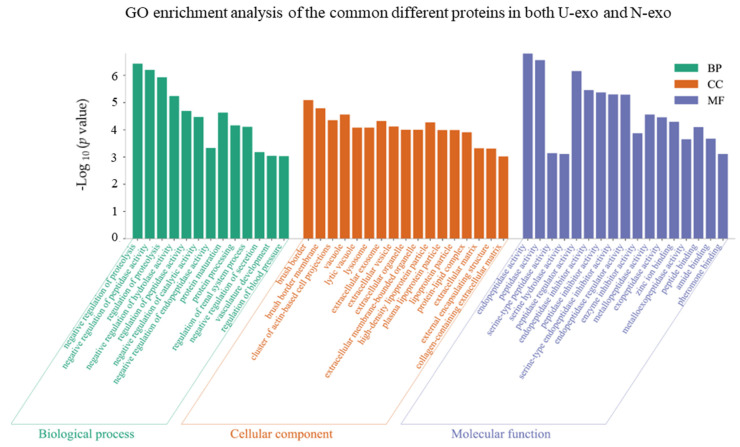
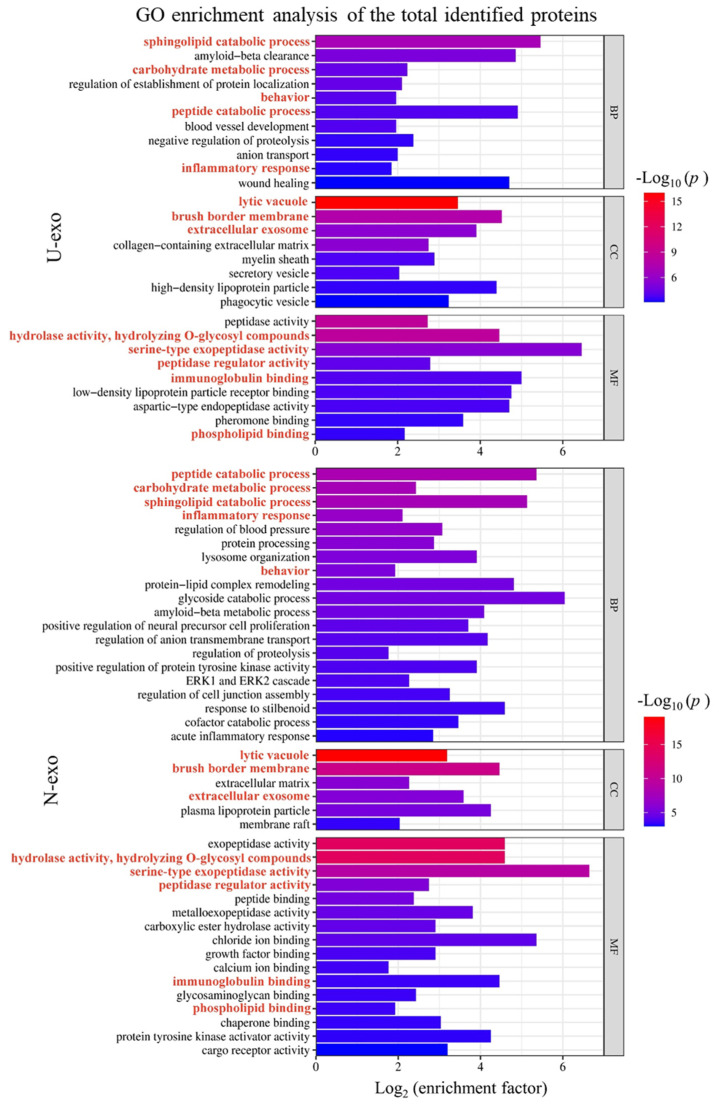
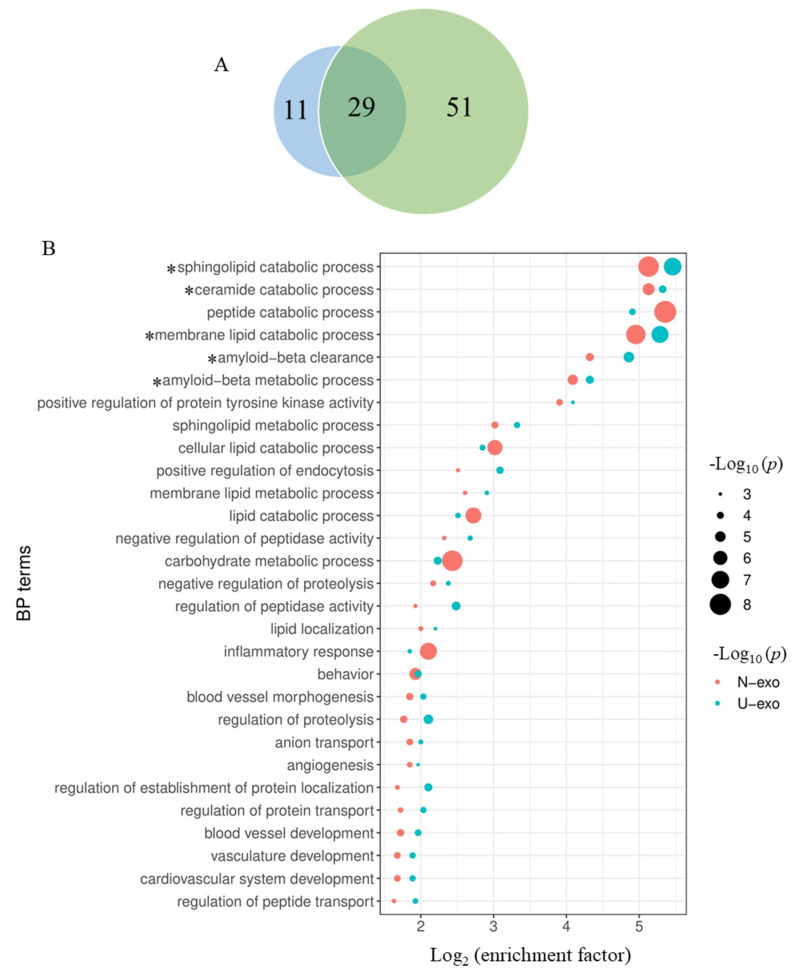
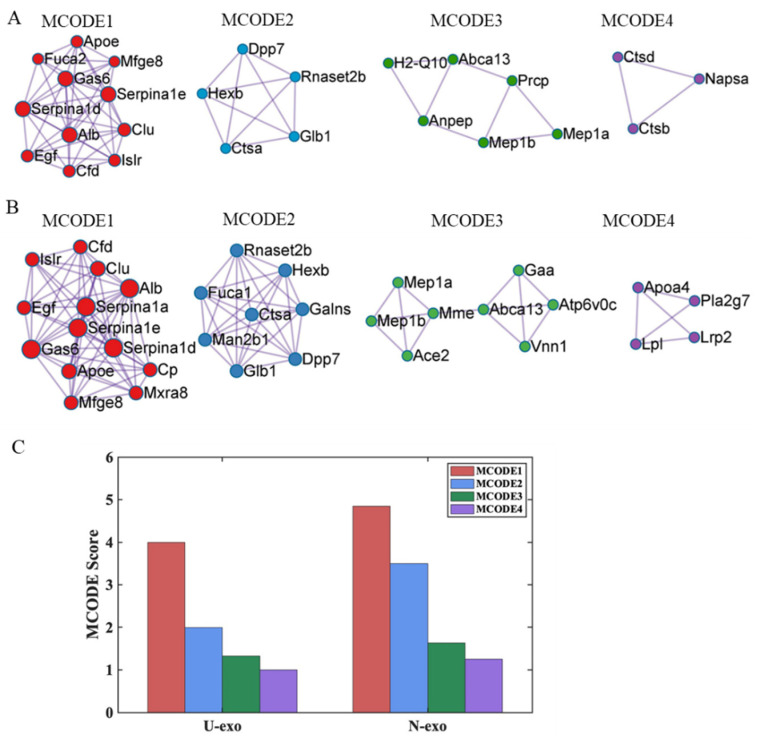
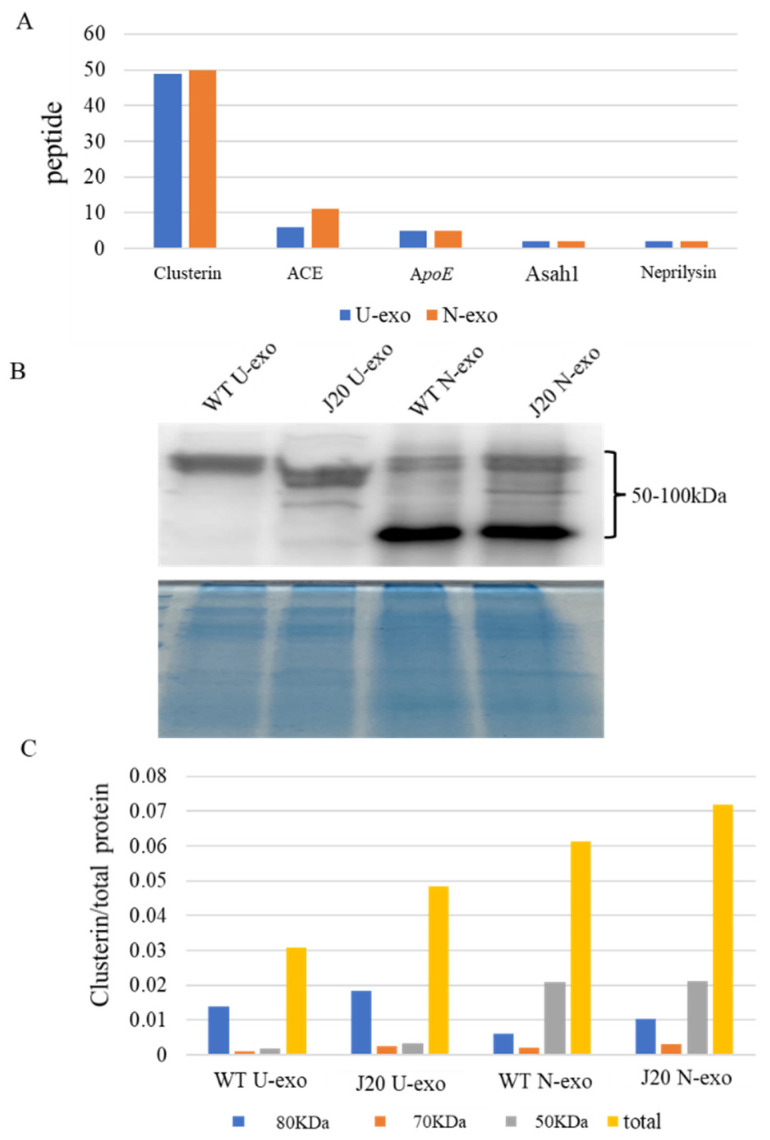
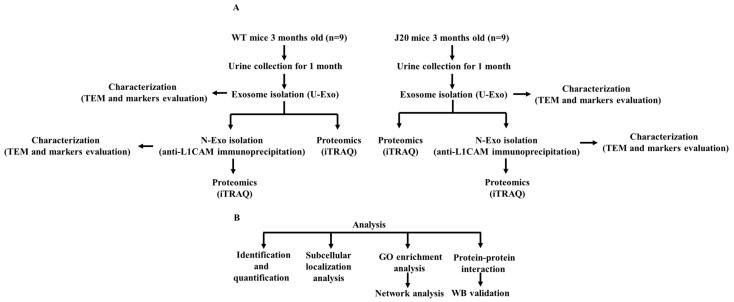
Alzheimer's disease (AD) is a common dementia disease in the elderly. To get a better understanding of the pathophysiology, we performed a proteomic analysis of the urine exosomes (U-exo) in AD model mice (J20). The polymer precipitation method was used to isolate U-exo from the urine of 3-month-old J20 and wild-type (WT) mice. Neuron-derived exosome (N-exo) was isolated from U-exo by immunoprecipitation. iTRAQ-based MALDI TOF MS/MS was used for proteomic analysis. The results showed that compared to WT, the levels of 61 and 92 proteins were increased in the J20 U-exo and N-exo, respectively. Gene ontology enrichment analysis demonstrated that the sphingolipid catabolic process, ceramide catabolic process, membrane lipid catabolic process, Aβ clearance, and Aβ metabolic process were highly enriched in U-exo and N-exo. Among these, Asah1 was shown to be the key protein in lipid metabolism, and clusterin, ApoE, neprilysin, and ACE were related to Aβ metabolism and clearance. Furthermore, protein-protein interaction analysis identified four protein complexes where clusterin and ApoE participated as partner proteins. Thus, J20 U-exo and N-exo contain proteins related to lipid- and Aβ-metabolism in the early stages of AD, providing a new insight into the underlying pathological mechanism of early AD.

Keywords: Alzheimer’s disease; amyloid beta; iTRAQ; proteomic analysis; urine exosomes.


Conflict of interest statement

The authors declare no conflict of interest.

Figures

Figure 1
Figure 1
Characterization of isolated exosomes. (A) Western blotting for detecting the exosomal markers of U-exo and N-exo. (B) Transmission electron microscope for imaging of U-exo and N-exo. U-exo: urine exosomes. N-exo: neuron-derived exosomes.
Figure 2
Figure 2
The comparison of the different proteins we identified in U-exo and N-exo. (A) Venn diagram reflecting the identified different proteins in U-exo and N-exo and (B) corresponding proteins. U-exo: urine exosomes. N-exo: neuron-derived exosomes.
Figure 3
Figure 3
Pie chart of subcellular localization of identified proteins. The online tool WoLF PSORT (https://psort.hgc.jp/ accessed on 27 August 2022) was used to conduct subcellular localization of identified proteins. According to species and multifasta format protein sequence, WoLF PSORT will calculate scores for possible localization sites. The larger the value, the more likely the protein is localized at the position. Only the subcellular location with the highest score was used to generate the percentage pie chart of subcellular localization (Tables S3 and S4 for details). U-exo: urine exosomes. N-exo: neuron-derived exosomes.
Figure 4
Figure 4
The comparison of the identified proteins which can be expressed in the brain in both U-exo and N-exo. (A) Venn diagram showing the identified proteins which can be expressed in the brain in both U-exo and N-exo and (B) corresponding proteins. (C) The percentage of the identified proteins which can be expressed in the brain to the total identified proteins. U-exo: urine exosomes. N-exo: neuron-derived exosomes.
Figure 5
Figure 5
GO enrichment analysis of the common different proteins identified in both U-exo and N-exo. U-exo: urine exosomes. N-exo: neuron-derived exosomes.
Figure 6
Figure 6
Bar graph for the gene ontology enrichment analysis of the total identified proteins in U-exo and N-exo. We carried out hierarchical clustering analysis on the enriched terms of the identified proteins in U-exo and N-exo. The most statistically significant term (smallest p value) within a cluster is chosen to represent the cluster. Pathway enrichment is measured by p value and enrichment factor. The smaller the p value, the larger the value of the enrichment factor, and the higher the enrichment degree of the corresponding term. The bar color is displayed in a gradient from red to blue, and the enriched BP terms were ranked in descending order of the −Log10 (p value). The length of the bar represents Log2 (enrichment factor). BP: biological process. CC: cellular component. MF: molecular function. U-exo: urine exosomes. N-exo: neuron-derived exosomes.
Figure 7
Figure 7
Comparison of the BP enrichment analysis between the identified proteins of U-exo and N-exo. (A) Venn diagram showing the enriched BP terms of the identified proteins in U-exo and N-exo. The blue area represents the enriched BP terms of the identified proteins in U-exo, while the green area represents the enriched BP terms of the identified proteins in N-exo. (B) Dot bubble plot for displaying the overlapped enriched BP terms between U-exo and N-exo. Pathway enrichment is measured by p value and enrichment factor. Node color represents the sample group (red represents the N-exo group and blue represents the U-exo group). The size of the nodes is arranged in descending order of the −log10 (p value). The x-axis represents log2 (enrichment factor). The enriched BP terms were ranked in descending order of the value of log2 (enrichment factor). * represent important enriched BP pathways for further analysis. BP: biological process. U-exo: urine exosomes. N-exo: neuron-derived exosomes.
Figure 8
Figure 8
Protein–protein interaction analysis of the identified proteins in U-exo and N-exo. MCODE components identified from the identified protein lists in (A) U-exo and (B) N-exo. The MCODE algorithm was applied to identify densely connected network components. (C) The MCODE score value of identified MCODE components. The visualization of all MCODE components was generated with Cytoscape 3.8.0. Colors show the different components of MCODE (red color: MCODE 1, blue color: MCODE 2, green color: MCODE 3, and purple color: MCODE 4). MCODE: molecular complex detection.
Figure 9
Figure 9
Validation of the most important protein. (A) Comparison of the number of distinct peptides with at least 95% confidence among screened important proteins in the early stages of AD pathology. (B) Western blotting for clusterin. The total protein stained by Coomassie brilliant blue (CBB) was used as loading control. (C) Relative levels of clusterin among groups. Clusterin was normalized by the total protein stained by CBB. U-exo: urine exosomes. N-exo: neuron-derived exosomes.
Figure 10
Figure 10
Workflow of experiment design. (A) Isolation, characterization, and proteomics of urine exosomes (U-exo) and neuron-derived exosomes (N-exo) in male mice with the human amyloid precursor protein (hAPP) transgene (J20) and their wild-type (WT) littermate control. First, the U-exo was isolated from urine by polymer precipitation, then N-exo was isolated from U-exo by immunoprecipitation with the anti-neural cell adhesion molecule L1 (L1CAM) antibody. Second, the two exosomes were characterized by transmission electron microscope (TEM) and Western blotting (WB). Lastly, the protein profiles of U-exo and N-exo were identified using isobaric tags for relative and absolute quantitation (iTRAQ)-based matrix assisted laser desorption ionization time of flight mass spectrometry/mass spectrometry (MALDI TOF MS/MS). (B) Bioinformatics analysis and protein validation. The identified proteins were analyzed by bioinformatic analysis. Then, the most important proteins screened by bioinformatics were validated by WB.

References

    1. Khan S., Barve K.H., Kumar M.S. Recent advancements in pathogenesis, diagnostics and treatment of alzheimer’s disease. Curr. Neuropharmacol. 2020;18:1106–1125. doi: 10.2174/1570159X18666200528142429. - DOI - PMC - PubMed
    1. Murphy M.P., LeVine H. Alzheimer’s disease and the amyloid-beta peptide. J. Alzheimers Dis. 2010;19:311–323. doi: 10.3233/JAD-2010-1221. - DOI - PMC - PubMed
    1. Calsolaro V., Edison P. Neuroinflammation in Alzheimer’s disease: Current evidence and future directions. Alzheimers Dement. 2016;12:719–732. doi: 10.1016/j.jalz.2016.02.010. - DOI - PubMed
    1. Grammas P. Neurovascular dysfunction, inflammation and endothelial activation: Implications for the pathogenesis of Alzheimer’s disease. J. Neuroinflammation. 2011;8:26. doi: 10.1186/1742-2094-8-26. - DOI - PMC - PubMed
    1. Chew H., Solomon V.A., Fonteh A.N. Involvement of lipids in alzheimer’s disease pathology and potential therapies. Front. Physiol. 2020;11:598. doi: 10.3389/fphys.2020.00598. - DOI - PMC - PubMed