. 2022 Dec 31;24(1):707.
doi: 10.3390/ijms24010707.

Fecal Volatile Organic Compounds and Microbiota Associated with the Progression of Cognitive Impairment in Alzheimer's Disease

Affiliations

Fecal Volatile Organic Compounds and Microbiota Associated with the Progression of Cognitive Impairment in Alzheimer's Disease

Cristina Ubeda et al. Int J Mol Sci. .

Abstract

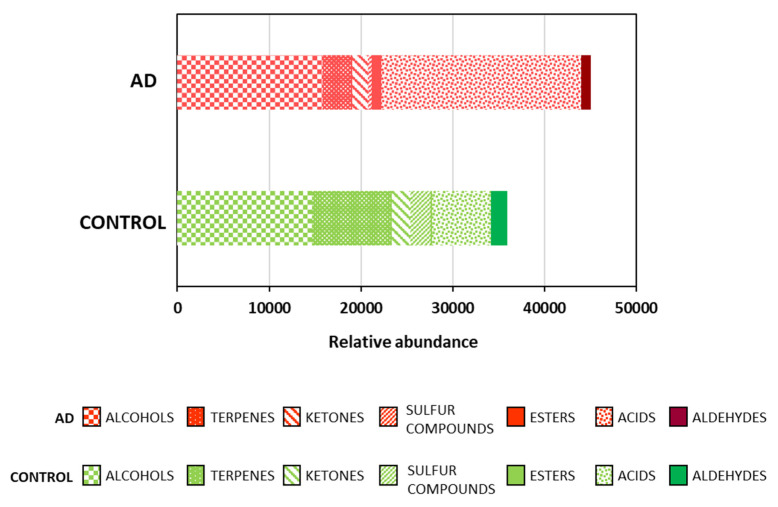
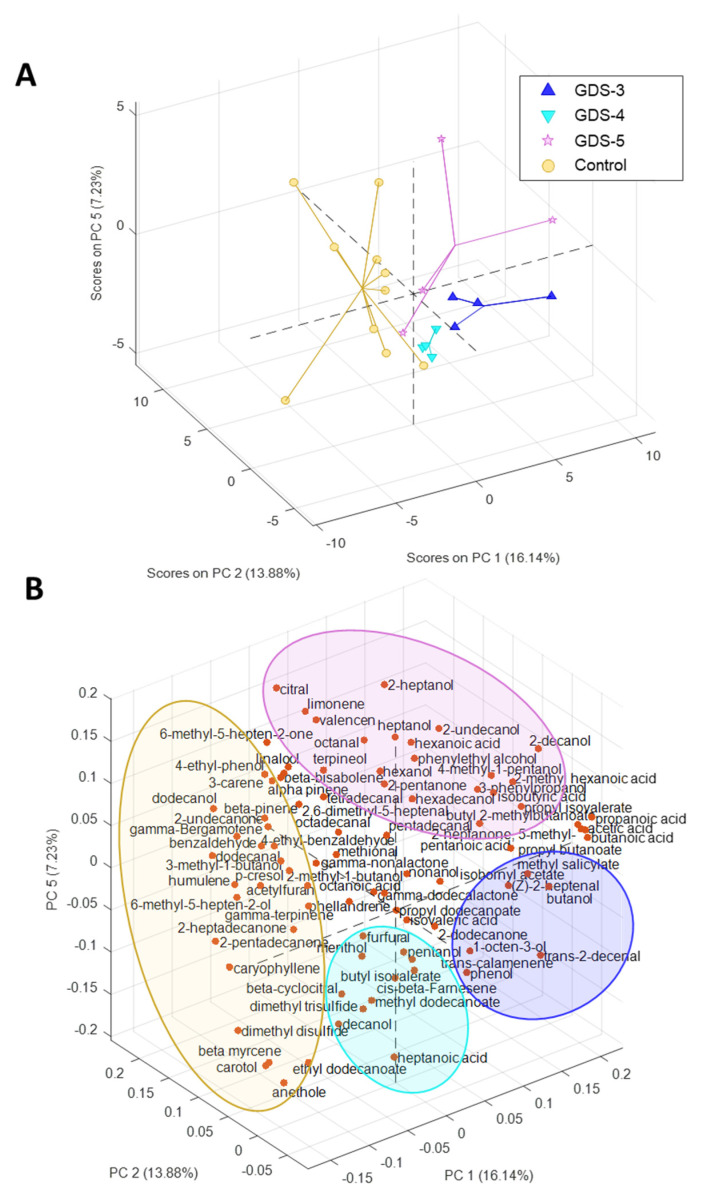
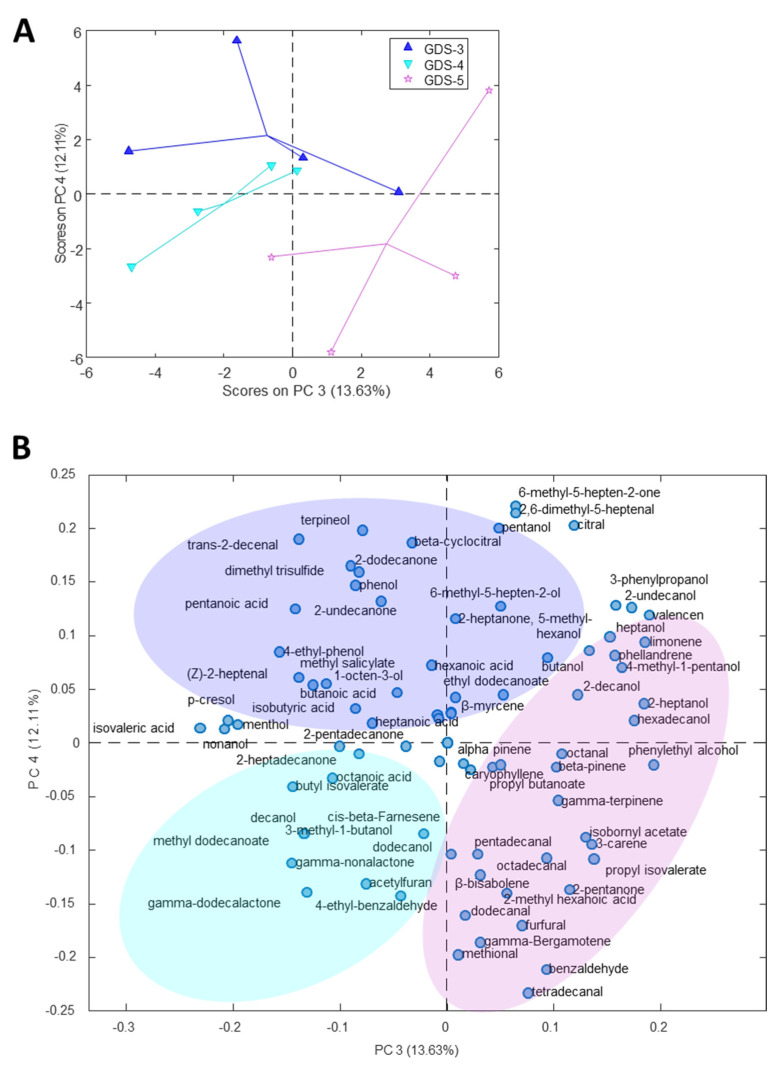
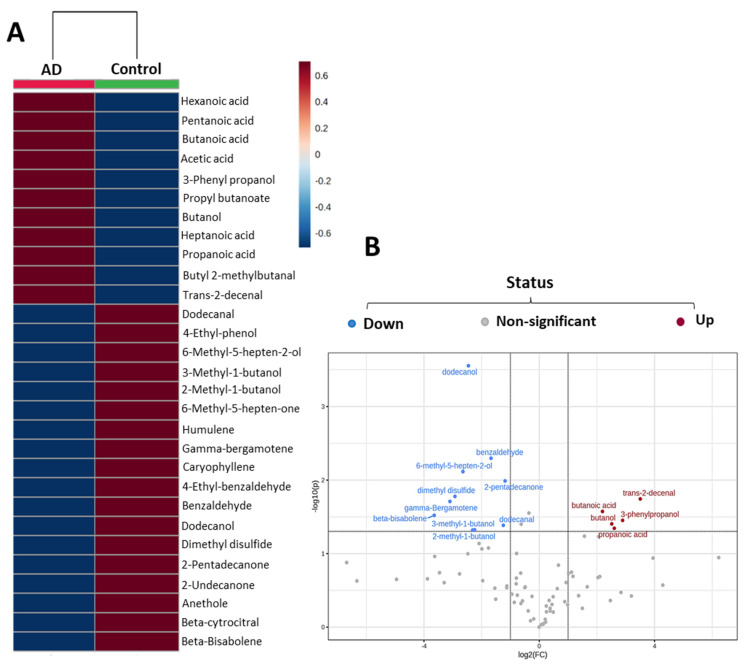
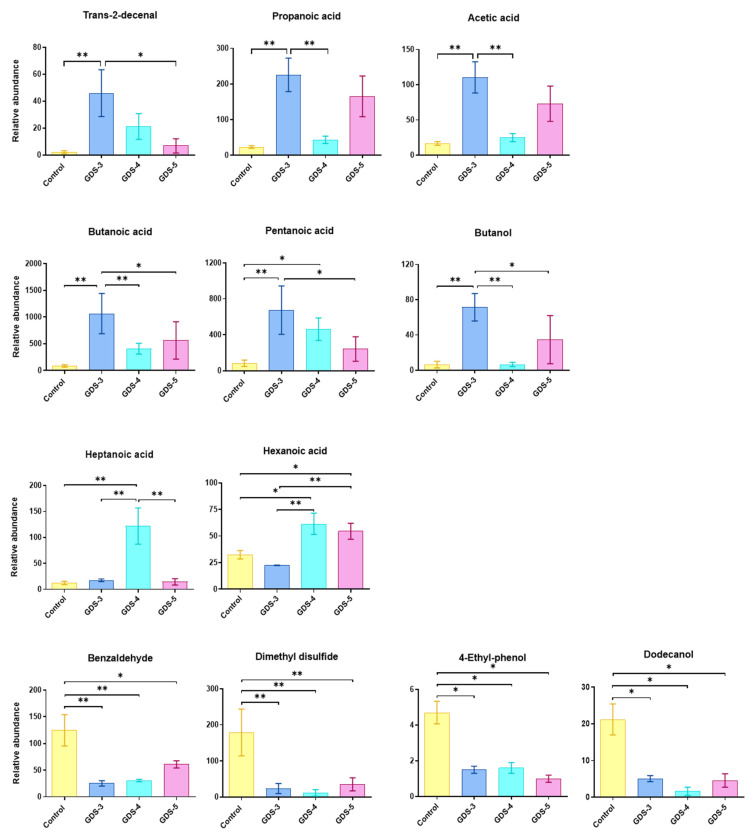
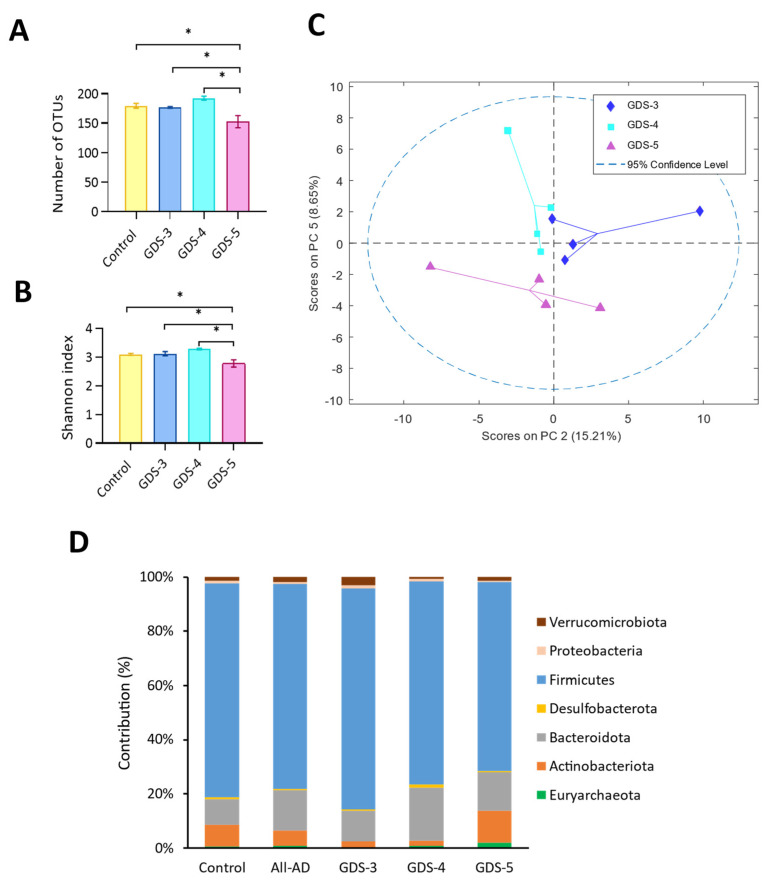
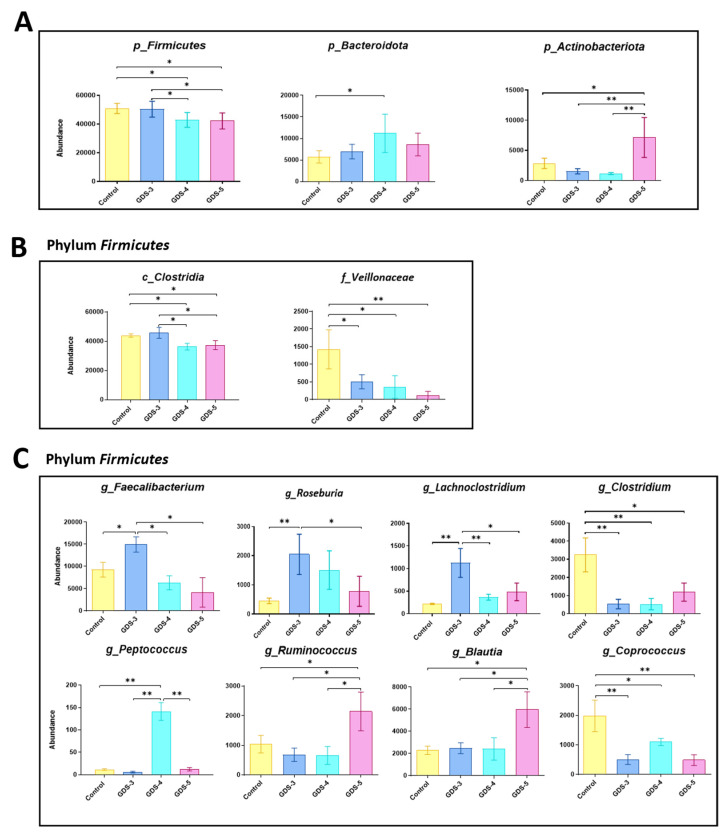
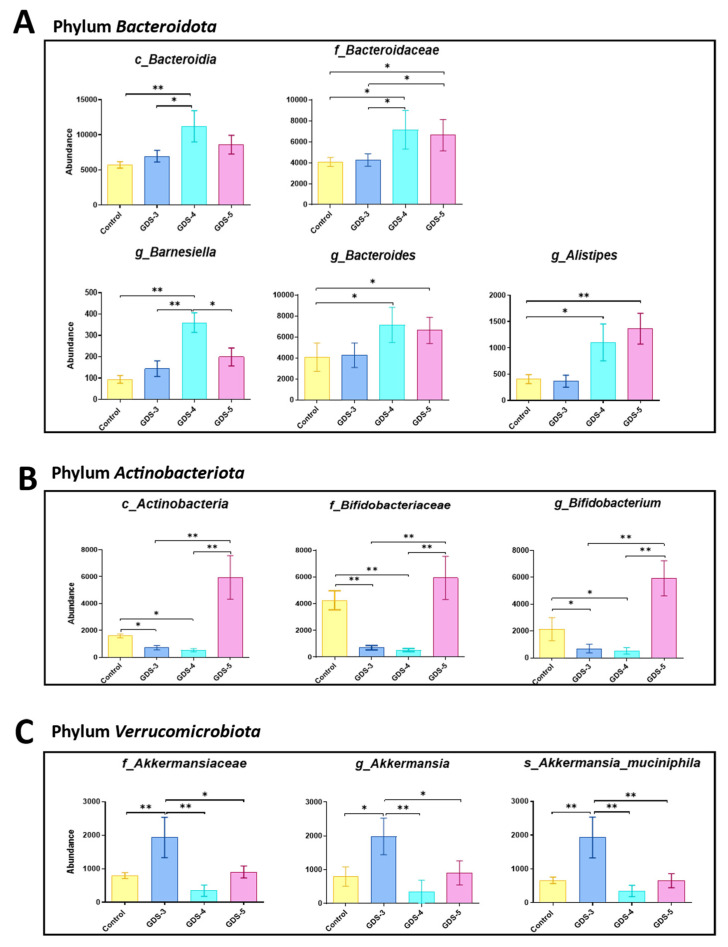
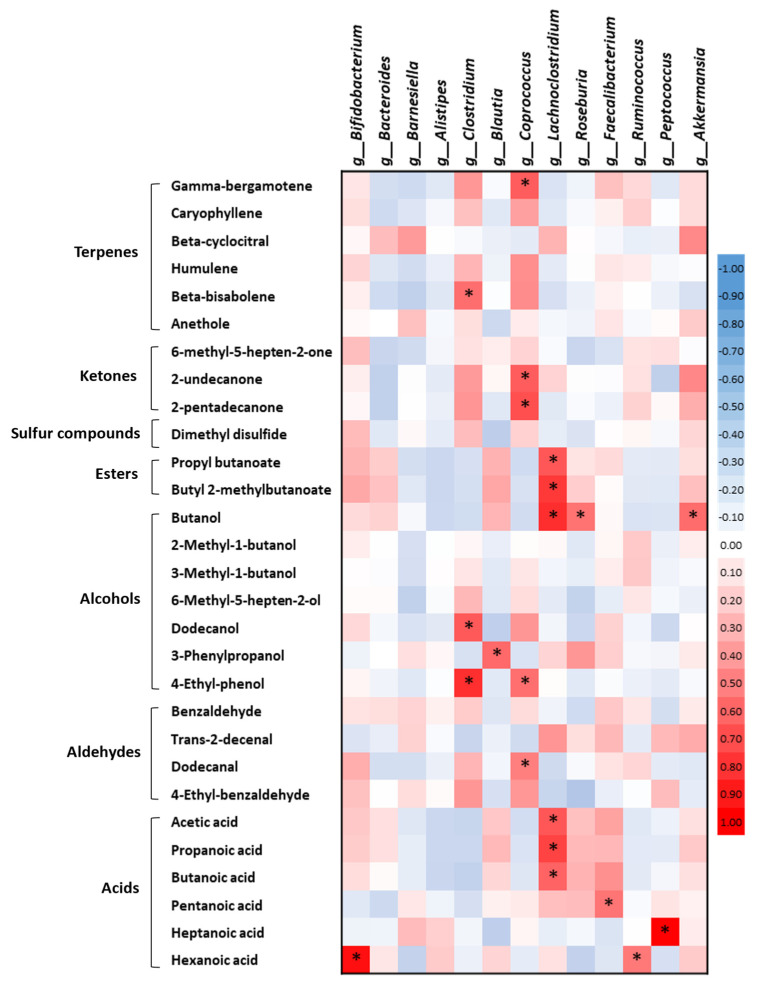
Metabolites produced by an altered gut microbiota might mediate the effects in the brain. Among metabolites, the fecal volatile organic compounds (VOCs) are considered to be potential biomarkers. In this study, we examined both the VOCs and bacterial taxa in the feces from healthy subjects and Alzheimer's disease (AD) patients at early and middle stages. Remarkably, 29 fecal VOCs and 13 bacterial genera were differentiated from the healthy subjects and the AD patients. In general, higher amounts of acids and esters were found in in the feces of the AD patients and terpenes, sulfur compounds and aldehydes in the healthy subjects. At the early stage of AD, the most relevant VOCs with a higher abundance were short-chain fatty acids and their producing bacteria, Faecalibacterium and Lachnoclostridium. Coinciding with the development of dementia in the AD patients, parallel rises of heptanoic acid and Peptococcus were observed. At a more advanced stage of AD, the microbiota and volatiles shifted towards a profile in the feces with increases in hexanoic acid, Ruminococcus and Blautia. The most remarkable VOCs that were associated with the healthy subjects were 4-ethyl-phenol and dodecanol, together with their possible producers Clostridium and Coprococcus. Our results revealed a VOCs and microbiota crosstalk in AD development and their profiles in the feces were specific depending on the stage of AD. Additionally, some of the most significant fecal VOCs identified in our study could be used as potential biomarkers for the initiation and progression of AD.

Keywords: Alzheimer’s disease; cognitive impairment; fecal volatile compounds; gut microbiota; metabolome; short-chain fatty acids.


Conflict of interest statement

The authors declare no conflict of interest.

Figures

Figure 1
Figure 1
Relative abundance of the volatile organic compounds (VOCs) in the feces from the control subjects and the Alzheimer’s disease (AD) patients; (n = 10, control subjects; n = 12, AD patients).
Figure 2
Figure 2
Principal component analysis (PCA) of the fecal volatile organic compounds (VOCs) in Alzheimer’s disease (AD) and the control subjects. The (A) scores and (B) loadings plots of the PCA model carried out with the relative peak area of the total VOCs obtained from the control subjects and the AD patients classified in the stages: GDS-3, GDS-4 and GDS-5; (n = 10, control subjects; n = 12, AD patients; 4 per stage).
Figure 3
Figure 3
Principal component analysis (PCA) of the fecal volatile organic compounds (VOCs) in Alzheimer’s disease (AD). The (A) scores and (B) loadings plots of the PCA model developed with the fecal samples from the AD patients and the relative peak area of the total VOCs identified; (n = 12, AD patients; 4 per stage).
Figure 4
Figure 4
Most relevant fecal volatile organic compounds (VOCs) in the control subjects and the Alzheimer’s disease (AD) patients. (A) Heatmap plot of the 29 most relevant VOCs selected by the VIP scores. (B) Volcano plot developed with the relative peak area of the total VOCs identified. The more significant VOCs are colored in blue (down) and in red (up); (n = 10, control subjects; n = 12, AD patients; 4 per stage).
Figure 5
Figure 5
Fecal volatile organic compounds (VOCs) selected by the VIP scores in the control subjects and the Alzheimer’s disease (AD) patients who showed significant differences between the control and/or the AD stages. The VOCs relative abundance in the feces from the control subjects and AD patients were classified in stages GDS-3, GDS-4 and GDS-5. The data are the means ± the SEM, (n = 10, control subjects; n = 12, AD patients; 4 per stage). The ANOVA showed an effect (p < 0.05) of AD classified in the stages on the relative abundance of the selected VOCs. Tukey’s test: * p < 0.05 and ** p < 0.01.
Figure 6
Figure 6
Dendrogram with a Spearman distance measure and a Ward clustering algorithm obtained from the total of VOCs identified in the feces from the control subjects and the Alzheimer’s disease (AD) patients. The pairs of the samples highlighted with an arrow correspond to the married couples; (n = 10, control subjects; n = 12, AD patients).
Figure 7
Figure 7
Gut microbiota composition in the feces from the control subjects and the Alzheimer’s disease (AD) patients classified in the stages GDS-3, GDS-4 and GDS-5. (A) The richness calculated as the number of the unique operational taxonomic units (OTUs) present in a subject. (B) The alpha diversity calculated using the Shannon index at the genus level. The ANOVA shows the significant differences in AD at GDS-5 (p < 0.05). The data are the means ± the SEM; Tukey’s test: * p < 0.05. (C) The principal component analysis (PCA) of the gut microbiota. The scores of the PCA model were carried out with the area of the relative abundance at the genus level from the AD patients at GDS-3, GDS-4 and GDS-5. (D) The relative contribution of the bacterial taxa at the phylum level in the control subjects and the AD patients at GDS-3, GDS-4 and GDS-5; (n = 10, control subjects; n = 12, AD patients; 4 per stage).
Figure 8
Figure 8
Gut microbiota in the Alzheimer’s disease (AD) patients and the control subjects. The relative abundance of the bacterial taxa in the feces from the control subjects and the AD patients classified in the stages GDS-3, GDS-4 and GDS-5. The data are the means ± the SEM; (n = 10, control subjects; n = 12, AD patients; 4 per stage). (A) The bacterial phylum. (B) The bacterial class and the family belonging to the Firmicutes phylum. (C) The genera belonging to the Firmicutes phylum. The ANOVA shows an effect (p < 0.05) between AD classified in the stages and the bacterial taxa. Tukey’s test: * p < 0.05 and ** p < 0.01. p, phylum; c, class; f, family; g, genus.
Figure 9
Figure 9
Gut microbiota in the Alzheimer’s disease (AD) patients and the control subjects. The relative abundance of the bacterial taxa in the feces from the control subjects and the AD patients classified in the stages GDS-3, GDS-4 and GDS-5. The data are the means ± the SEM; (n = 10, control subjects; n = 12, AD patients; 4 per stage). (A) The bacterial class, family and genera belonging to the phylum Bacteroidota. (B) The bacterial class, family and genera belonging to the phylum Actinobacteria. (C) The family Akkermansiaceae, genus Akkermansia and species Akkermansia muciniphila. The ANOVA shows an effect (p < 0.05) between the bacterial taxa and the AD patients classified in the stages. Tukey’s test: * p < 0.05and ** p < 0.01. c, class; f, family; g, genus, s, species.
Figure 10
Figure 10
Associations of the fecal volatile organic compounds (VOCs) with the gut microbiota in Alzheimer’s disease (AD). A hierarchical heat map with the correlations between the fecal VOCs selected by the VIP score and the bacterial genera that were statistically significant in the ANOVA analysis. The red squares indicate a positive correlation while the blue squares indicate a negative correlation. The statistical analysis of the correlation coefficient was performed with a t-test. An asterisk indicates the statistical significance; (n = 10, control subjects; n = 12, AD patients).
Figure 11
Figure 11
Calprotectin in the Alzheimer’s disease (AD) patients and the control subjects. The fecal samples from the control subjects and the AD patients classified in the stages GDS-3, GDS-4 and GDS-5. The fecal calprotectin levels were expressed as μg calprotectin/g of the feces. The data are the means ± the SEM; (n = 10, control subjects; n = 12, AD patients; 4 per stage).

References

    1. Apostolova L.G. Alzheimer Disease. Continuum. 2016;22:419–434. doi: 10.1212/CON.0000000000000307. - DOI - PMC - PubMed
    1. Reisberg B., Ferris S.H., De Leon M.J., Crook T. The Global Deterioration Scale for assessment of primary degenerative dementia. Am. J. Psychiatry. 1982;139:1136–1139. - PubMed
    1. Lane C.A., Hardy J., Schott J.M. Alzheimer’s disease. Eur. J. Neurol. 2018;25:59–70. doi: 10.1111/ene.13439. - DOI - PubMed
    1. Kowalski K., Mulak A. Brain-gut-microbiota axis in Alzheimer’s disease. J. Neurogastroenterol. Motil. 2019;25:48–60. doi: 10.5056/jnm18087. - DOI - PMC - PubMed
    1. Tarawneh R., Penhos E. The gut microbiome and Alzheimer’s disease: Complex and bidirectional interactions. Neurosci. Biobehav. Rev. 2022;141:104814. doi: 10.1016/j.neubiorev.2022.104814. - DOI - PMC - PubMed