

Modeling Analysis of a Polygeneration Plant Using a CeO2/Ce2O3 Chemical Looping
- PMID: 36614653
- PMCID: PMC9822425
- DOI: 10.3390/ma16010315
Modeling Analysis of a Polygeneration Plant Using a CeO2/Ce2O3 Chemical Looping
Abstract
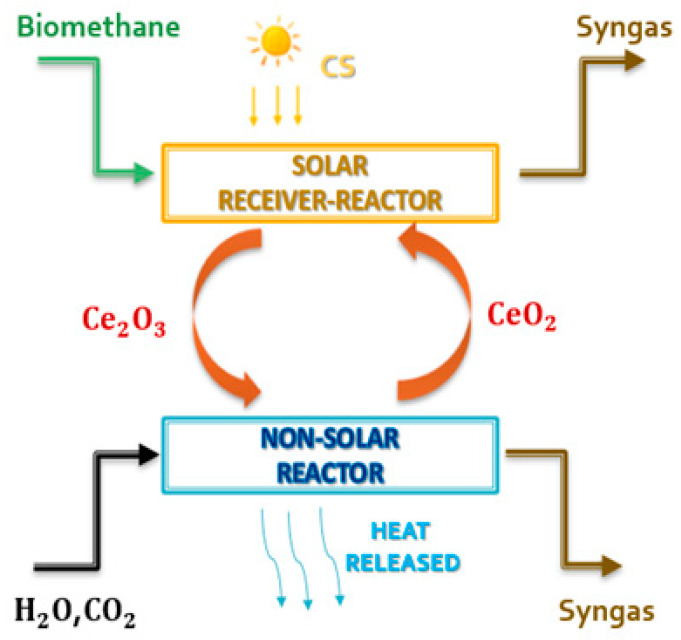
In the current context of complexity between climate change, environmental sustainability, resource scarcity, and geopolitical aspects of energy resources, a polygenerative system with a circular approach is considered to generate energy (thermal, electrical, and fuel), contributing to the control of CO2 emissions. A plant for the multiple productions of electrical energy, thermal heat, DME, syngas, and methanol is discussed and analyzed, integrating a chemical cycle for CO2/H2O splitting driven using concentrated solar energy and biomethane. Two-stage chemical looping is the central part of the plant, operating with the CeO2/Ce2O3 redox couple and operating at 1.2 bar and 900 °C. The system is coupled to biomethane reforming. The chemical loop generates fuel for the plant's secondary units: a DME synthesis and distillation unit and a solid oxide fuel cell (SOFC). The DME synthesis and distillation unit are integrated with a biomethane reforming reactor powered by concentrated solar energy to produce syngas at 800 °C. The technical feasibility in terms of performance is presented in this paper, both with and without solar irradiation, with the following results, respectively: overall efficiencies of 62.56% and 59.08%, electricity production of 6.17 MWe and 28.96 MWe, and heat production of 111.97 MWt and 35.82 MWt. The fuel production, which occurs only at high irradiance, is 0.71 kg/s methanol, 6.18 kg/s DME, and 19.68 kg/s for the syngas. The increase in plant productivity is studied by decoupling the operation of the chemical looping with a biomethane reformer from intermittent solar energy using the heat from the SOFC unit.
Keywords: CS; DME; SOFC; biological methane; ceria oxides; chemical looping; polygenerative system.
Conflict of interest statement
The authors declare no conflict of interest.
Figures


References
-
- IPCC-Report—Global Warming of 1.5 °C. 2018. [(accessed on 15 August 2020)]. Available online: https://www.ipcc.ch/sr15/download/
-
- Stocker M., Qin T.F., Plattner D. Climate Change 2013: The Physical Science Basis. Contribution of Working Group I to the Fifth Assessment Report of the Intergovernmental Panel on Climate Change. Cambridge University; Cambridge, UK: New York, NY, USA: 2013.
-
- European Commission Strategic Energy Technology Plan. 2017. [(accessed on 23 October 2021)]. Available online: - DOI
-
- US EPA . Sources of Greenhouse Gas Emissions. United States Environmental Protection Agency; Washington, DC, USA: 2017. [(accessed on 25 November 2021)]. Available online: https://www.epa.gov/ghgemissions/sources-greenhouse-gas-emissions.
-
- Ampah J.D., Jin C., Fattah I.M.R., Appiah-Otoo I., Afrane S., Geng Z., Yusuf A.A., Li T., Mahlia T.I., Liu H. Investigating the evolutionary trends and key enablers of hydrogen production technologies: A patent-life cycle and econometric analysis. [(accessed on 26 August 2022)];Int. J. Hydrogen Energy. 2022 doi: 10.1016/j.ijhydene.2022.07.258. Available online: - DOI
LinkOut - more resources
Full Text Sources
