. 2022 Dec 30;16(1):375.
doi: 10.3390/ma16010375.

Degradation Processes of Medieval and Renaissance Glazed Ceramics

Affiliations

Degradation Processes of Medieval and Renaissance Glazed Ceramics

Mária Kolářová et al. Materials (Basel). .

Abstract

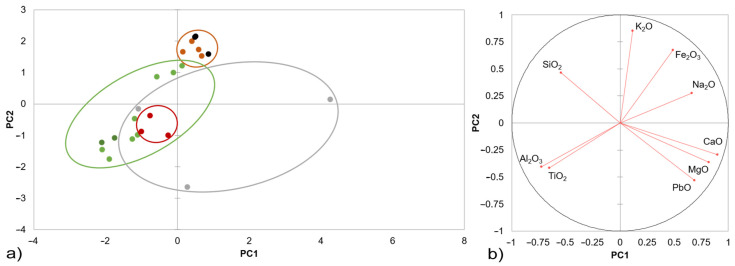
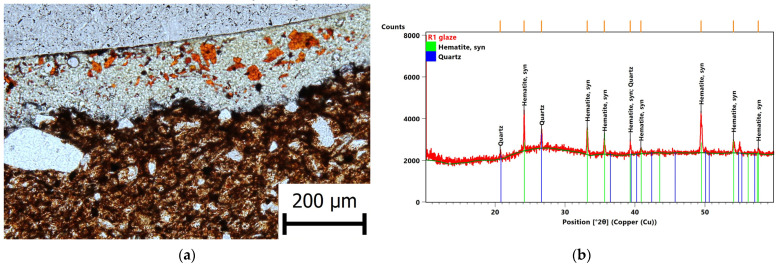
Corrosion effects in deposit environments (soil, waste pit, etc.), together with the glaze adherence and fit, could cause severe deterioration accompanied by different types of defects or growth of corrosion products. The aim of this work was to identify the source of surface degradation of the lead-glazed ceramics sets from the Prague area from the Romanesque to the Renaissance period. A combination of X-ray fluorescence (XRF), X-ray diffraction (XRD), optical microscopy (OM), scanning electron microscopy with energy dispersive X-ray spectroscopy (SEM/EDS), and simultaneous thermal analysis (STA) techniques along with stress state calculations was used to study the defects. Based on the interpretation of the possible sources of the observed defects, four types of degradation effects were schematically expressed for the archaeological samples. It was shown that the glazes were already appropriately chosen during the production of the Romanesque tiles and that their degradation occurred only due to long-term exposure to unsuitable environmental conditions.

Keywords: archaeological lead-glazed ceramics; archaeometric characterisation; degradation; glaze fit.


Conflict of interest statement

The authors declare no conflict of interest.

Figures

Figure 1
Figure 1
Map of the Prague district indicating the location of the studied sets: R—Romanesque St. Wenceslas Rotunda at Charles University, G—Gothic Benedictine Arch-Abbey, S—Salm Palace, W—Schwarzenberg Palace, T—Prague Castle complex waste pit B, F—Prague Castle complex waste pit H and C, M1—Prague Castle complex waste pit C. Source: Mapy.cz.
Figure 2
Figure 2
Principal component analysis biplot of the XRF data measured for the ceramic bodies of the studied archaeological fragments: (a) Romanesque floor tiles (brown dots), Gothic floor tiles (black dots), Renaissance stove tiles (green dots), large-format reliefs (dark-green dots), technical ceramics (red dots), and Modern Age utility ceramics and faiences (grey dots); (b) correlation circle with vectors of the investigated variables of the main oxides. The PC1 is the one that extracts the maximum variance, and PC2 is the one that extracts the maximum variance from what is left.
Figure 3
Figure 3
PCA biplot of the XRF data measured for the glazes of the studied archaeological fragments: (a) Romanesque floor tiles (brown dots), Gothic floor tiles (black dots), Renaissance stove tiles (green dots), large-format reliefs (dark-green dots), technical ceramics (red dots), Modern Age utility ceramics (grey dots), and blue onglaze decorations of faiences (blue dots); (b) correlation circle with vectors of the active variables. The PC1 is the one that extracts the maximum variance, and PC2 is the one that extracts the maximum variance from what is left.
Figure 4
Figure 4
Hematite as colouring agent: (a) thin section image of a transparent glaze with hematite crystals and a corrosion product in the form of hydrated phosphates on the surface of the glaze; (b) XRD pattern of the glaze G3—the orange lines show positions of diffraction lines.
Figure 5
Figure 5
XRD pattern of the representative glaze F1 with cassiterite as the main crystalline phase of sample F1 white glaze—cassiterite accompanied by marcasite as a minor crystalline phase. The orange lines show positions of diffraction lines.
Figure 6
Figure 6
Images of degraded glazed surfaces of the Romanesque samples: (a) R1; (b) cracked surface of R4; (c) growth of corrosion products in the glaze of R4 due to deposit in soil with high quantity of phosphates; (d) stress relationships of the samples of the Romanesque glazed floor tile glazes measured by TMA, verified by the SciGlass calculations and the ceramic bodies measured by DIL; (e) the detail of the (d) in 85 % zoom.
Figure 7
Figure 7
Sample of a Gothic tile: (a,c) stereomicroscope images of a degraded glaze; (b) relative expansions of the ceramic body measured four times; (d) stress states of the system calculated from each dilatometric measurement of the ceramic body.
Figure 8
Figure 8
Tensile stress within the brown glaze of the pipkin M1 proves the poor glaze fit of the crazed glaze and accompanied by degradation mechanisms: (a) SEM image of the glaze layer; (c,d) stereomicroscope images of the crazed glaze with mechanical abrasions, crazing and pitting corrosion; (b) stress relationship of the M1 sample.
Figure 9
Figure 9
Tension behaviour of the stove tile glazes confirmed by the stress calculations: (a,c) crazed surface of the glazes of stove tiles S4 and S5 with pinhole corrosion; (b) calculated and measured relative expansion curves of stove tile S5; (d) stress relationships of stove tiles S1, S4, S5, S7, and S8.
Figure 10
Figure 10
Flexion behaviour of the Renaissance Faience: (a) thin section image of sample F1; (b) stress relationships of the two-component system of white glazes and ceramic bodies; (c) stereomicroscope image of the abraded surfaces; (d) stress state of the two-component system of white and blue glaze.
Figure 11
Figure 11
Moisture expansion of the ceramic bodies of the technical ceramics and large-format reliefs affected the glaze fit and flexion behaviour of the glaze-ceramic body systems T1, T2, T3, W1, and W2: (a) thin section image of the W2 sample; (b) TG-DTA-dTG curves of the ceramic body T2; (c) TG-DTA-dTG curves of the ceramic body T2; (d) relative expansion curves and numerical derivative as a function of the relative dilatation of the W2 ceramic body sample.
Figure 12
Figure 12
A scheme of the possible degradation and defect growth processes: (A) stress relationships and primary crazing or peeling of a glaze; (B) delayed (secondary) crazing of a glaze supported by moisture expansion of the body; (C) delayed (secondary) crazing of a glaze supported by moisture expansion of the body; (D) delayed (secondary) crazing of a glaze supported by moisture expansion of the body, red dots shows corrosion products.

References

    1. Özçatal M., Yaygingöl M., İssi A., Turan S., Okyar F., Pfeiffer Taş Ş., Nastova I., Grupče O., Minčeva-Šukarova B. Characterization of lead glazed potteries from Smyrna (Izmir/Turkey) using multiple analytical techniques; Part I: Glaze and engobe. Ceram. Int. 2014;40:2143–2151. doi: 10.1016/j.ceramint.2013.09.014. - DOI
    1. Domoney K., Shortland A.J., Kuhn S. Characterization of 18th-century Meissen porcelain using SEM-EDS. Archaeometry. 2012;54:454–474. doi: 10.1111/j.1475-4754.2011.00626.x. - DOI
    1. Doménech-Carbó A., Doménech-Carbó M.T. Electrochemical characterization of archaeological tin-opacified lead-alkali glazes and their corrosion processes. Electroanalysis. 2005;17:1959–1969. doi: 10.1002/elan.200503322. - DOI
    1. Maltoni S., Silvestri A., Maritan L., Molin G. The Medieval lead-glazed pottery from Nogara (north-east Italy): A multi-methodological study. J. Archaeol. Sci. 2012;39:2071–2078. doi: 10.1016/j.jas.2012.03.016. - DOI
    1. Figueiredo M.O., Silva T.P., Veiga J.P. A XANES study of the structural role of lead in glazes from decorated tiles, XVI to XVIII century manufacture. Appl. Phys. A. 2006;83:209–211. doi: 10.1007/s00339-006-3509-0. - DOI

LinkOut - more resources