

In Search of an Imaging Classification of Adenomyosis: A Role for Elastography?
- PMID: 36615089
- PMCID: PMC9821156
- DOI: 10.3390/jcm12010287
In Search of an Imaging Classification of Adenomyosis: A Role for Elastography?
Abstract
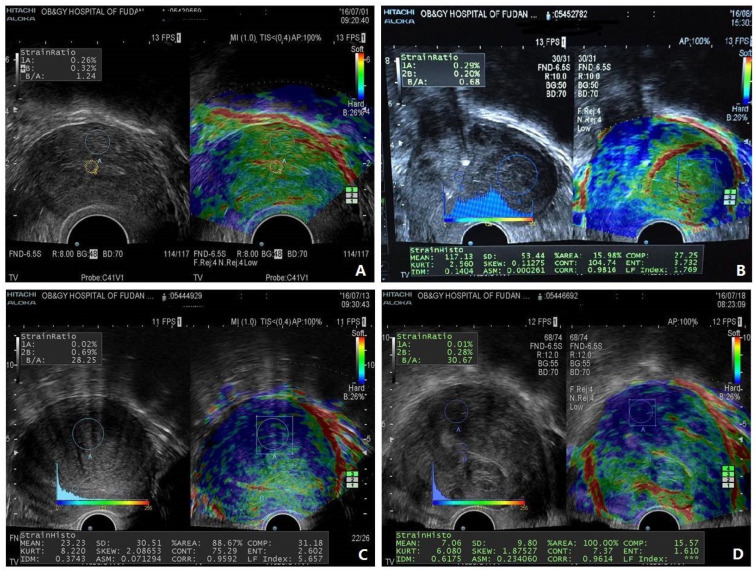
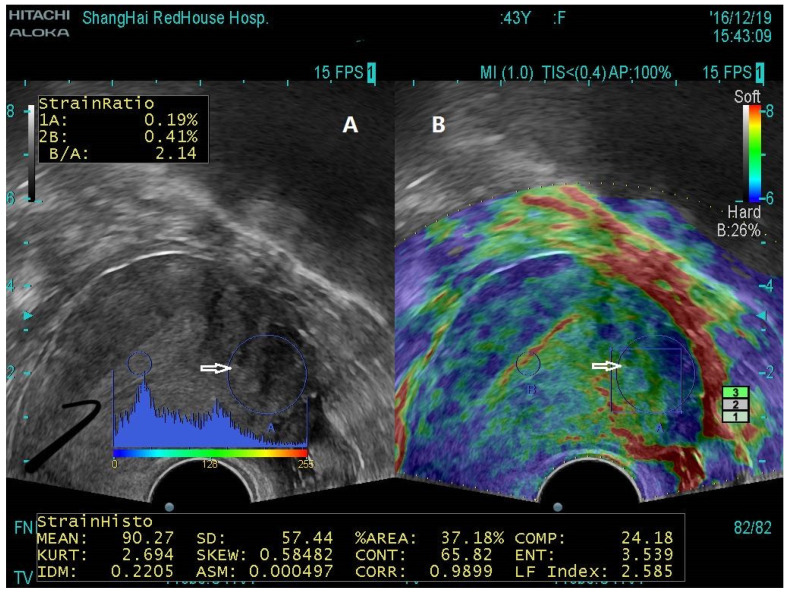
Adenomyosis is a complex and poorly understood gynecological disease. It used to be diagnosed exclusively by histology after hysterectomy; today its diagnosis is carried out increasingly by imaging techniques, including transvaginal ultrasound (TVUS) and magnetic resonance imaging (MRI). However, the lack of a consensus on a classification system hampers relating imaging findings with disease severity or with the histopathological features of the disease, making it difficult to properly inform patients and clinicians regarding prognosis and appropriate management, as well as to compare different studies. Capitalizing on our grasp of key features of lesional natural history, here we propose adding elastographic findings into a new imaging classification of adenomyosis, incorporating affected area, pattern, the stiffest value of adenomyotic lesions as well as the neighboring tissues, and other pathologies. We argue that the tissue stiffness as measured by elastography, which has a wider dynamic detection range, quantitates a fundamental biologic property that directs cell function and fate in tissues, and correlates with the extent of lesional fibrosis, a proxy for lesional "age" known to correlate with vascularity and hormonal receptor activity. With this new addition, we believe that the resulting classification system could better inform patients and clinicians regarding prognosis and the most appropriate treatment modality, thus filling a void.
Keywords: adenomyosis; elastography; fibrosis; imaging classification; magnetic resonance imaging; transvaginal ultrasound.
Conflict of interest statement
All authors declare no conflict of interest.
Figures

Similar articles
-
Transvaginal Elastosonography as an Imaging Technique for Diagnosing Adenomyosis.Reprod Sci. 2018 Apr;25(4):498-514. doi: 10.1177/1933719117750752. Epub 2018 Jan 10. Reprod Sci. 2018. PMID: 29320956
-
Real-time elastography for assessment of uterine disorders.Ultrasound Obstet Gynecol. 2014 Feb;43(2):218-26. doi: 10.1002/uog.12519. Epub 2014 Jan 12. Ultrasound Obstet Gynecol. 2014. PMID: 23703939
-
Diagnosing Deep Endometriosis Using Transvaginal Elastosonography.Reprod Sci. 2020 Jul;27(7):1411-1422. doi: 10.1007/s43032-019-00108-2. Epub 2020 Apr 24. Reprod Sci. 2020. PMID: 32333226
-
Recent advances in understanding and managing adenomyosis.F1000Res. 2019 Mar 13;8:F1000 Faculty Rev-283. doi: 10.12688/f1000research.17242.1. eCollection 2019. F1000Res. 2019. PMID: 30918629 Free PMC article. Review.
-
Transvaginal Ultrasound for the Diagnosis of Adenomyosis: Systematic Review and Meta-Analysis.J Minim Invasive Gynecol. 2018 Feb;25(2):257-264. doi: 10.1016/j.jmig.2017.08.653. Epub 2017 Aug 30. J Minim Invasive Gynecol. 2018. PMID: 28864044
Cited by
-
The Asian Society of Endometriosis and Adenomyosis guidelines for managing adenomyosis.Reprod Med Biol. 2023 Sep 10;22(1):e12535. doi: 10.1002/rmb2.12535. eCollection 2023 Jan-Dec. Reprod Med Biol. 2023. PMID: 37701076 Free PMC article.
-
A method for isolating and culturing ectopic epithelial and stromal cells to study human adenomyosis.Arch Gynecol Obstet. 2024 Feb;309(2):551-563. doi: 10.1007/s00404-023-07254-8. Epub 2023 Oct 23. Arch Gynecol Obstet. 2024. PMID: 37872452
References
Publication types
Grants and funding
LinkOut - more resources
Full Text Sources
