Review
. 2022 Dec 25;28(1):175.
doi: 10.3390/molecules28010175.

Comprehensive Survey of Consensus Docking for High-Throughput Virtual Screening

Affiliations
Review

Comprehensive Survey of Consensus Docking for High-Throughput Virtual Screening

Clara Blanes-Mira et al. Molecules. .

Abstract

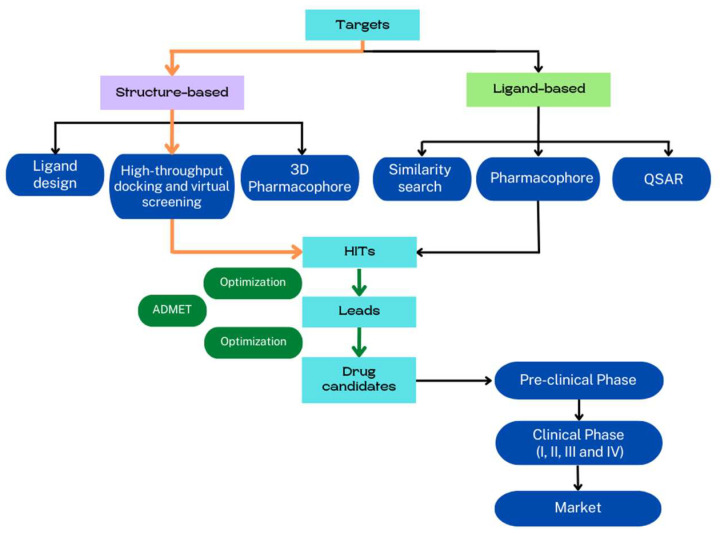
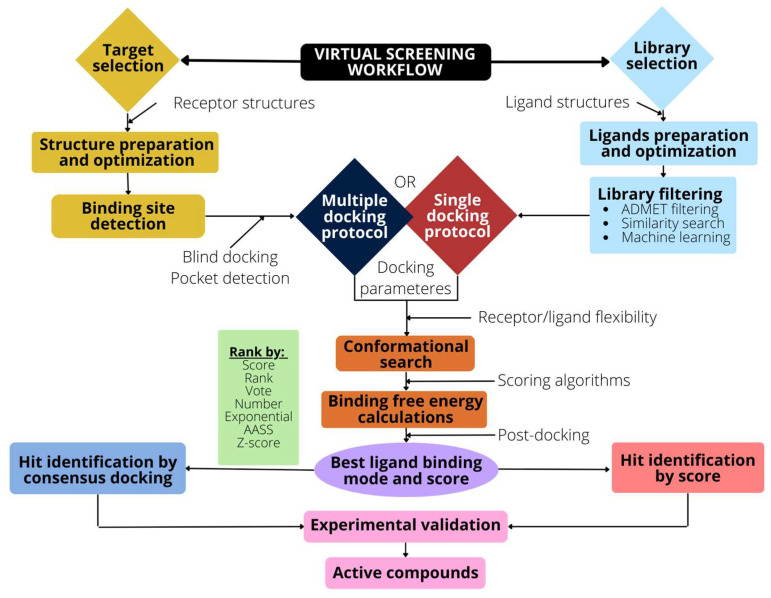
The rapid advances of 3D techniques for the structural determination of proteins and the development of numerous computational methods and strategies have led to identifying highly active compounds in computer drug design. Molecular docking is a method widely used in high-throughput virtual screening campaigns to filter potential ligands targeted to proteins. A great variety of docking programs are currently available, which differ in the algorithms and approaches used to predict the binding mode and the affinity of the ligand. All programs heavily rely on scoring functions to accurately predict ligand binding affinity, and despite differences in performance, none of these docking programs is preferable to the others. To overcome this problem, consensus scoring methods improve the outcome of virtual screening by averaging the rank or score of individual molecules obtained from different docking programs. The successful application of consensus docking in high-throughput virtual screening highlights the need to optimize the predictive power of molecular docking methods.

Keywords: binding site; consensus docking; drug discovery; molecular docking; scoring function; virtual screening.


Conflict of interest statement

The authors declare no conflict of interest.

Figures

Figure 1
Figure 1
Schematic representation of the drug development cycle. Protocols are mainly classified into structure- and ligand-based methods. Identified hits are optimized to obtain potential candidates for experimental testing. ADMET (absorption, distribution, metabolism, excretion, and toxicity) criteria can be used as additional filters to reduce pre-clinical and clinical attrition rates of potential drugs. The orange arrows indicate the protocols revised.
Figure 2
Figure 2
Different levels of docking simplification. (A) Rigid docking: neither the receptor (blue) nor ligand (yellow) are allowed to change conformation during the docking process. (B) Rigid receptor, flexible ligand: only the small organic molecule (ligand) is allowed to change conformation. Different shapes represent different conformations of the same ligand molecule. The algorithm explores different poses and determines the best score. (C) Semi-flexible docking: in addition to the ligand flexibility, the receptor is allowed to change the conformation of a few residues in the binding pocket (cyan) to facilitate ligand interaction. (D) Flexible docking: both receptor and ligand are free to change conformation, to improve receptor–ligand matching. Different shapes represent different conformations of the receptor (blue) or ligand (yellow).
Figure 3
Figure 3
Schematic representation of the VS workflow. The selection and optimization of the target (receptor) is followed by the binding pocket detection and the preparation of the docking input files. Library selection requires optimization and preparation to filter undesired ligands. An ADMET filtering or similarity search can also be used to reduce the ligand space. Docking algorithms are then used to generate poses and scores. The use of a post-docking analysis, such as consensus docking, improves the VS method’s performance.
Figure 4
Figure 4
Structure of TRPV1 in the presence of the activator capsaicin, (PDB code: 7LR0). (A) Front and top views of TRPV1 in colored illustrations. The horizontal black bars indicate the approximated location of the lipidic membrane and separate the transmembrane (TM) and the cytosolic domains. (B) Vanilloid pocket located between two subunits (blue and green) including the capsaicin as determined by cryo-EM (salmon) or re-docked by AutoDock Vina (golden) and the sidechains delineating the pocket.
Figure 5
Figure 5
Dispersion of docking results in TRPV1. (A) Correlation between the results of AutoDock Vina and PLANTS. The docking results of AutoDock Vina were ranked and plotted against the ranking of the same molecules in PLANTS. The red dots represent the inhibitors obtained from the ChEMBL database while the grey dots indicate the decoys obtained from DUD-E. (B) A Venn diagram representing the intersections between four different docking programs (Vina, PLANTS, RxDock and DSX) used on TRPV1. The numbers indicate the amount of shared compounds detected by the different docking methods. The overlapping degree shown was calculated using the top 1000 molecules of the rankings.
Figure 6
Figure 6
Screening performance of docking programs and consensus strategies. (A) area under the curve of the receiver operating characteristics (AUC-ROC). The box plot represents the area obtained for all docking programs and the consensus strategies (NSR: normalized score ratio; ECR: exponential consensus ranking; RBR: rank-by-rank; RBV: rank-by-vote; RBN: rank-by-number: AASS: auto-scaled score; and Z-score). The horizontal line inside the box represents the median value of the distribution, and dots are considered outliers. The mean and the standard deviation were estimated with the bootstrap method (1000 samples). (B) Semi-logarithmic representation of EP for docking and consensus strategies. The grey area encompasses the results of the individual docking programs, showing the worst and the best performance. Colored lines represent the performance of the consensus strategies at a given percentage of the database.

References

    1. Dhasmana A.R., Jahan S.R., Lohani M., Arif J.M. Chapter 19—High-Throughput Virtual Screening (HTVS) of Natural Compounds and Exploration of Their Biomolecular Mechanisms: An In Silico Approach. In: Ahmad M.S., Khan I.A., Chattopadhyay D., editors. New Look to Phytomedicine. Academic Press; Cambridge, MA, USA: 2019. pp. 523–548.
    1. Arrowsmith J., Miller P. Trial watch: Phase II and phase III attrition rates 2011-2012. Nat. Rev. Drug. Discov. 2013;12:569. doi: 10.1038/nrd4090. - DOI - PubMed
    1. Smith C. Drug target validation: Hitting the target. Nature. 2003;422 doi: 10.1038/422341b. - DOI - PubMed
    1. Kontoyianni M. Docking and Virtual Screening in Drug Discovery. Methods Mol. Biol. 2017;1647:255–266. - PubMed
    1. Parker C.N., Bajorath J. Towards Unified Compound Screening Strategies: A Critical Evaluation of Error Sources in Experimental and Virtual High-Throughput Screening. Qsar. Comb. Sci. 2006;25:1153–1161. doi: 10.1002/qsar.200610069. - DOI

LinkOut - more resources