. 2022 Dec 28;28(1):263.
doi: 10.3390/molecules28010263.

Dihydrogen Bonding-Seen through the Eyes of Vibrational Spectroscopy

Affiliations

Dihydrogen Bonding-Seen through the Eyes of Vibrational Spectroscopy

Marek Freindorf et al. Molecules. .

Abstract

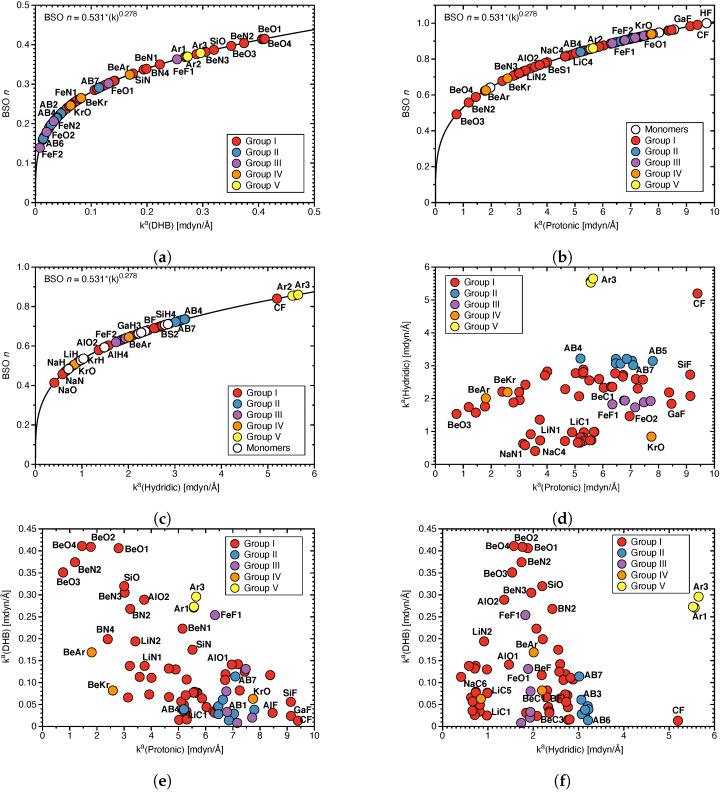
In this work, we analyzed five groups of different dihydrogen bonding interactions and hydrogen clusters with an H3+ kernel utilizing the local vibrational mode theory, developed by our group, complemented with the Quantum Theory of Atoms-in-Molecules analysis to assess the strength and nature of the dihydrogen bonds in these systems. We could show that the intrinsic strength of the dihydrogen bonds investigated is primarily related to the protonic bond as opposed to the hydridic bond; thus, this should be the region of focus when designing dihydrogen bonded complexes with a particular strength. We could also show that the popular discussion of the blue/red shifts of dihydrogen bonding based on the normal mode frequencies is hampered from mode-mode coupling and that a blue/red shift discussion based on local mode frequencies is more meaningful. Based on the bond analysis of the H3+(H2)n systems, we conclude that the bond strength in these crystal-like structures makes them interesting for potential hydrogen storage applications.

Keywords: blue/red shifts; dihydrogen bonding; hydride complexes; hydrogen storage; local vibrational mode analysis.


Conflict of interest statement

The authors declare no conflict of interest.

Figures

Figure 2
Figure 2
(a) BSO n values for DHB, (b) BSO n values for protonic parts of DHBs, and (c) BSO n values for hydridic parts of DHBs calculated from the corresponding local mode force constants as described in the text. (d) Correlation between ka(Protonic) and ka(Hydridic), (e) between ka(Protonic) and ka(DHB), (f) between ka(Hydridic) and ka(DHB).
Figure 3
Figure 3
(a) Correlation of ka(DHB) and normalized energy density Hc/ρc. (b) Correlation of charge differences Δq (see Table 1 for definition) and ka(DHB).
Figure 4
Figure 4
(a) Correlation between binding energy Ebin scaled by the number of DHBs n and ka(DHB), (b) correlation between distance R(DHB) and ka(DHB), (c) correlation between protonic bond angle (X–Hδ+Hδ) and ka(DHB), (d) correlation between hydridic bond angle (Hδ+Hδ–Y) and ka(DHB).
Figure 5
Figure 5
(a) Local mode frequency shifts Δω of the protonic parts of DHBs. (b) Local mode frequency shifts Δω of the hydridic parts of DHBs, where a positive sign denotes a blue–shift and a negative sign a red–shift.
Figure 6
Figure 6
(a) CNM analysis for the BeO3 complex. (b) CNM analysis for the two reference molecules HOCL2 (DHB donor) and BeH (DHB acceptor) forming the complex.
Figure 7
Figure 7
(a) Correlation between local mode frequency shifts Δω(Hydridic) and Δω(Protonic). (b) Correlation between the relative frequency shifts Δω/ω(Hydridic) and Δω/ω(Protonic). (c) Correlation between Δω/ω(Protonic) and ka(DHB). (d) Correlation between Δω/ω(Hydridic) and ka(DHB).
Figure 8
Figure 8
(a) Correlation between Ebin/n and Δω/ω(Protonic). (b) Correlation between Ebin/n and Δω/ω(Hydridic). (c) Correlation between Hc/ρc(Protonic) and Δω/ω(Protonic). (d) Correlation of Hc/ρc(Hydridic) and Δω/ω(Hydridic).
Figure 9
Figure 9
(a) BSO n(HH) as a function of the local mode force constant ka(HH); power relationship based on H2 and H2+ references see text. (b) Correlation of distance R(HH) and ka(HH). (c) Correlation of ka(HH) and normalized energy density Hc/ρc.
Figure 1
Figure 1
Sketches of Group I–Group VI members and reference compounds investigated in this study. DHB distances (in Å) are given in blue. Short names of the complexes used throughout the manuscript are given in black.
Figure 1
Figure 1
Sketches of Group I–Group VI members and reference compounds investigated in this study. DHB distances (in Å) are given in blue. Short names of the complexes used throughout the manuscript are given in black.

References

    1. Karas L.J., Wu C.H., Das R., Wu J.I.C. Hydrogen bond design principles. Wiley Interdiscip. Rev. Comput. Mol. Sci. 2020;10:e1477. doi: 10.1002/wcms.1477. - DOI - PMC - PubMed
    1. Grabowski S.J. Understanding Hydrogen Bonds. The Royal Society of Chemistry; London, UK: 2021. (Theoretical and Computational Chemistry Series).
    1. Scheiner S. Understanding noncovalent bonds and their controlling forces. Int. J. Chem. Phys. 2020;153:140901. doi: 10.1063/5.0026168. - DOI - PubMed
    1. Arunan E. One Hundred Years After The Latimer and Rodebush Paper, Hydrogen Bonding Remains an Elephant! Indian J. Sci. 2020;100:249–255. doi: 10.1007/s41745-019-00154-4. - DOI
    1. Gibb B.C. The Centenary (maybe) of The Hydrogen Bond. Nat. Chem. 2020;12:665–667. doi: 10.1038/s41557-020-0524-2. - DOI - PubMed

LinkOut - more resources