

Ketogenic Diet Combined with Moderate Aerobic Exercise Training Ameliorates White Adipose Tissue Mass, Serum Biomarkers, and Hepatic Lipid Metabolism in High-Fat Diet-Induced Obese Mice
- PMID: 36615908
- PMCID: PMC9823610
- DOI: 10.3390/nu15010251
Ketogenic Diet Combined with Moderate Aerobic Exercise Training Ameliorates White Adipose Tissue Mass, Serum Biomarkers, and Hepatic Lipid Metabolism in High-Fat Diet-Induced Obese Mice
Abstract
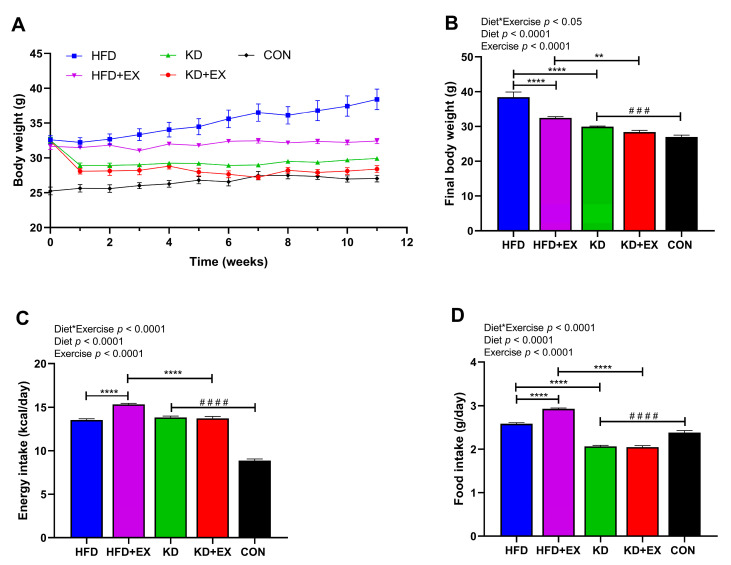
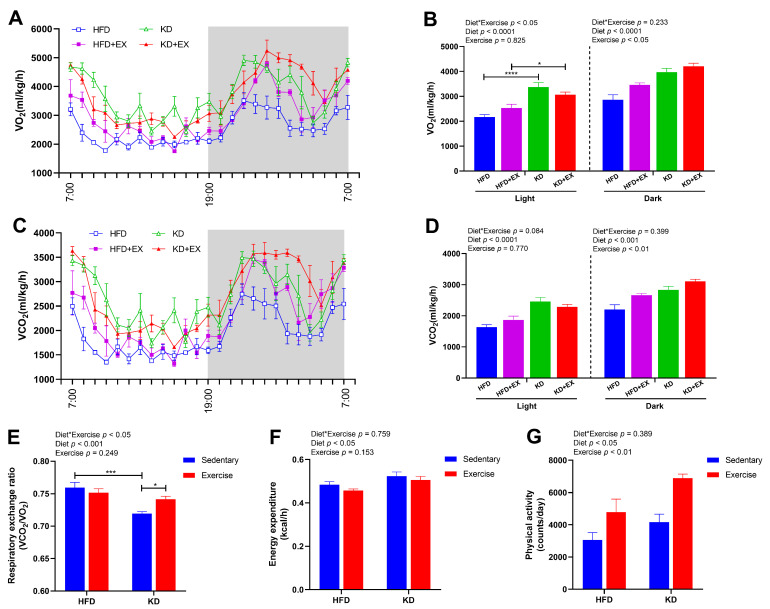
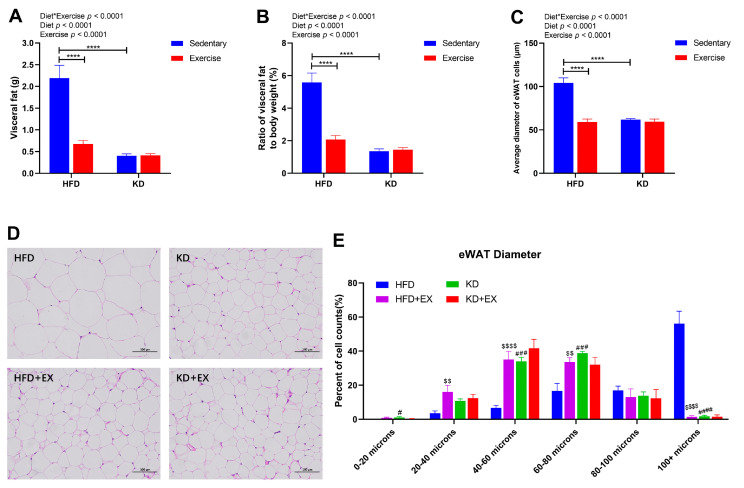
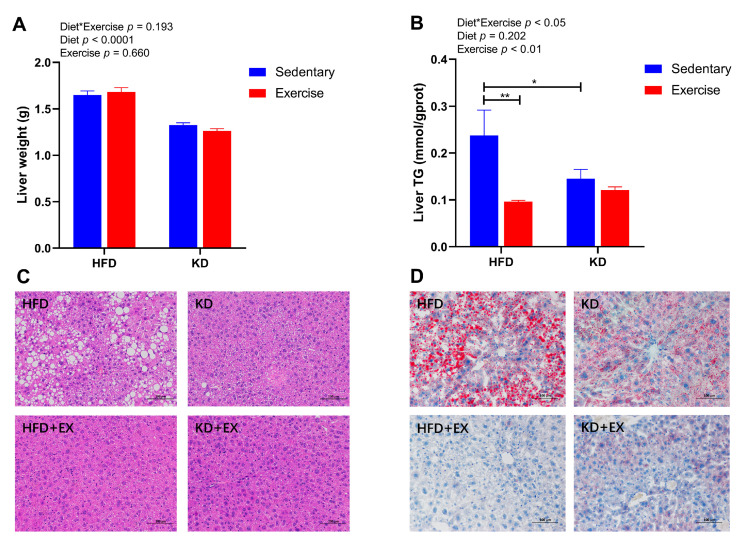
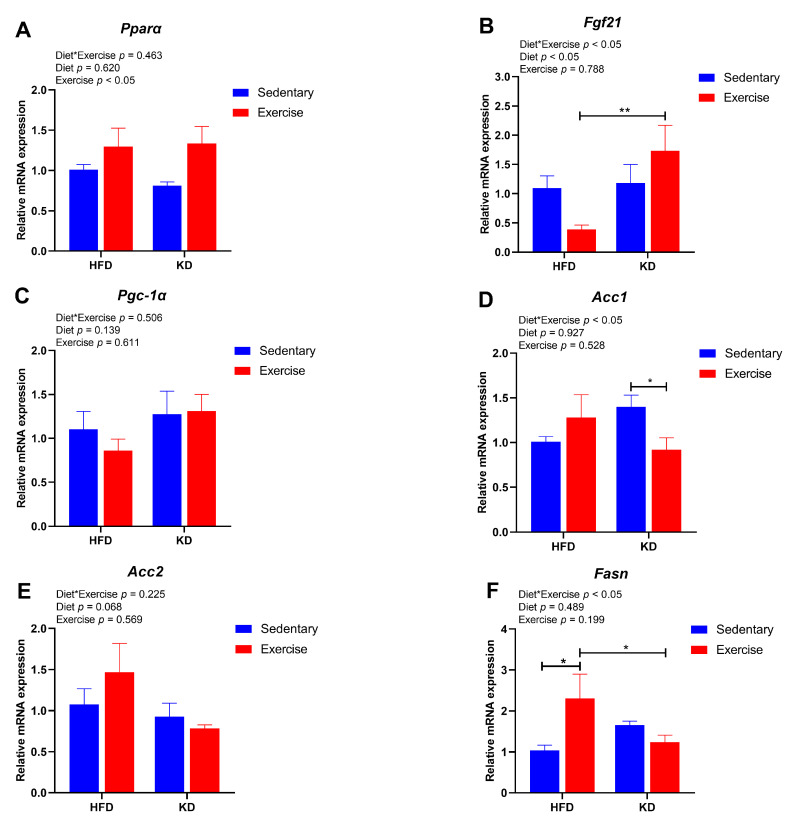
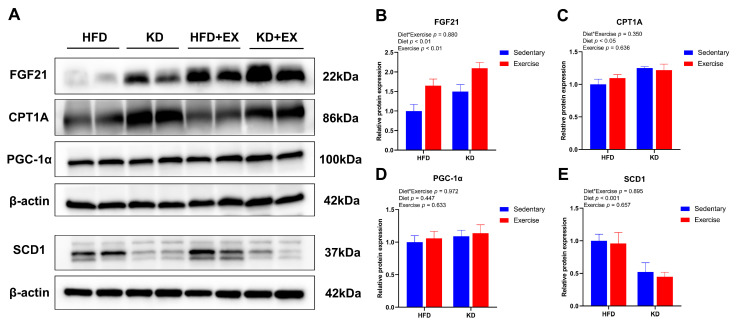
Obesity is a serious public health issue worldwide. Growing evidence demonstrates the efficacy of the ketogenic diet (KD) for weight loss, but there may be some adverse side effects such as dyslipidemia and hepatic steatosis. Aerobic exercise is a widely recognized approach for improving these metabolic markers. Here we explored the combined impacts of KD and moderate aerobic exercise for an 8-week intervention on body weight and fat loss, serum biomarkers, and hepatic lipid metabolism in a mouse model of high-fat diet-induced obesity. Both KD and KD combined with exercise significantly reduced body weight and fat mass. No significant adverse effects of KD were observed in serum biomarkers or hepatic lipid storage, except for an increase in circulating triglyceride level. However, aerobic exercise lowered serum triglyceride levels, and further ameliorated serum parameters, and hepatic steatosis in KD-fed mice. Moreover, gene and protein expression analysis indicated that KD combined with exercise was associated with increased expression of lipolysis-related genes and protein levels, and reduced expression of lipogenic genes relative to KD without exercise. Overall, our findings for mice indicate that further work on humans might reveal that KD combined with moderate aerobic exercise could be a promising therapeutic strategy for obesity.
Keywords: aerobic exercise; ketogenic diet; lipid metabolism; obesity.
Conflict of interest statement
The authors declare no conflict of interest.
Figures

Similar articles
-
Divya-WeightGo combined with moderate aerobic exercise remediates adiposopathy, insulin resistance, serum biomarkers, and hepatic lipid accumulation in high-fat diet-induced obese mice.Biomed Pharmacother. 2023 Jul;163:114785. doi: 10.1016/j.biopha.2023.114785. Epub 2023 May 1. Biomed Pharmacother. 2023. PMID: 37137183
-
Dietary tea seed saponin combined with aerobic exercise attenuated lipid metabolism and oxidative stress in mice fed a high-fat diet (HFD).J Food Biochem. 2022 Dec;46(12):e14461. doi: 10.1111/jfbc.14461. Epub 2022 Oct 6. J Food Biochem. 2022. PMID: 36200661
-
Long-term ketogenic diet contributes to glycemic control but promotes lipid accumulation and hepatic steatosis in type 2 diabetic mice.Nutr Res. 2016 Apr;36(4):349-358. doi: 10.1016/j.nutres.2015.12.002. Epub 2015 Dec 7. Nutr Res. 2016. PMID: 27001280
-
Metabolic Effects of Ketogenic Diets: Exploring Whole-Body Metabolism in Connection with Adipose Tissue and Other Metabolic Organs.Int J Mol Sci. 2024 Jun 27;25(13):7076. doi: 10.3390/ijms25137076. Int J Mol Sci. 2024. PMID: 39000187 Free PMC article. Review.
-
Ketogenic Diet Intervention for Obesity Weight-Loss- A Narrative Review, Challenges, and Open Questions.Curr Nutr Rep. 2025 Mar 8;14(1):43. doi: 10.1007/s13668-025-00634-3. Curr Nutr Rep. 2025. PMID: 40056334 Free PMC article. Review.
Cited by
-
Ketogenic therapy towards precision medicine for brain diseases.Front Nutr. 2024 Feb 21;11:1266690. doi: 10.3389/fnut.2024.1266690. eCollection 2024. Front Nutr. 2024. PMID: 38450235 Free PMC article. Review.
-
β-hydroxybutyrate and ischemic stroke: roles and mechanisms.Mol Brain. 2024 Jul 29;17(1):48. doi: 10.1186/s13041-024-01119-0. Mol Brain. 2024. PMID: 39075604 Free PMC article. Review.
-
An 8-week ketogenic diet improves exercise endurance and liver antioxidant capacity after weight loss in obese mice.Front Nutr. 2023 Dec 29;10:1322936. doi: 10.3389/fnut.2023.1322936. eCollection 2023. Front Nutr. 2023. PMID: 38223504 Free PMC article.
-
Advancing Obesity Management: the Very Low-Energy Ketogenic therapy (VLEKT) as an Evolution of the "Traditional" Ketogenic Diet.Curr Obes Rep. 2025 Apr 3;14(1):30. doi: 10.1007/s13679-025-00622-2. Curr Obes Rep. 2025. PMID: 40175850 Free PMC article. Review.
-
Ketogenic diet with aerobic exercise can induce fat browning: potential roles of β-hydroxybutyrate.Front Nutr. 2024 Aug 29;11:1443483. doi: 10.3389/fnut.2024.1443483. eCollection 2024. Front Nutr. 2024. PMID: 39267855 Free PMC article.
References
MeSH terms
Substances
Grants and funding
LinkOut - more resources
Full Text Sources
