. 2023 Jan 25;51(2):852-869.
doi: 10.1093/nar/gkac1224.

Identification and characterization of RNA binding sites for (p)ppGpp using RNA-DRaCALA

Affiliations

Identification and characterization of RNA binding sites for (p)ppGpp using RNA-DRaCALA

Jonathan Jagodnik et al. Nucleic Acids Res. .

Abstract

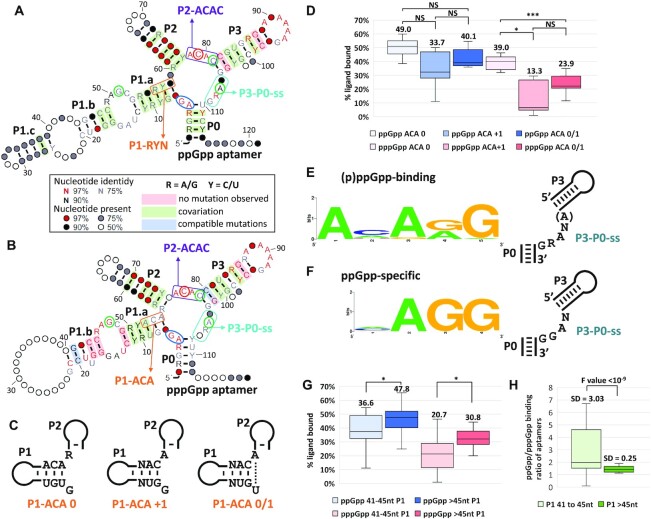
Ligand-binding RNAs (RNA aptamers) are widespread in the three domains of life, serving as sensors of metabolites and other small molecules. When aptamers are embedded within RNA transcripts as components of riboswitches, they can regulate gene expression upon binding their ligands. Previous methods for biochemical validation of computationally predicted aptamers are not well-suited for rapid screening of large numbers of RNA aptamers. Therefore, we utilized DRaCALA (Differential Radial Capillary Action of Ligand Assay), a technique designed originally to study protein-ligand interactions, to examine RNA-ligand binding, permitting rapid screening of dozens of RNA aptamer candidates concurrently. Using this method, which we call RNA-DRaCALA, we screened 30 ykkC family subtype 2a RNA aptamers that were computationally predicted to bind (p)ppGpp. Most of the aptamers bound both ppGpp and pppGpp, but some strongly favored only ppGpp or pppGpp, and some bound neither. Expansion of the number of biochemically verified sites allowed construction of more accurate secondary structure models and prediction of key features in the aptamers that distinguish a ppGpp from a pppGpp binding site. To demonstrate that the method works with other ligands, we also used RNA DRaCALA to analyze aptamer binding by thiamine pyrophosphate.


Figures

Graphical Abstract
Graphical Abstract
Identification and characterization of RNA binding sites for (p)ppGpp using RNA-DRaCALA.
Figure 1.
Figure 1.
Outline of RNA-DRaCALA. Schematic representation of RNA-DRaCALA by two methods. In method (A), the RNA is directly biotinylated via the 3′-end ligation of a biotinylated cytosine. In method (B), the RNA is tagged with an additional 3′ sequence, targeted by a biotinylated antisense DNA oligonucleotide. In both cases, Streptavidin binds to the biotinylated RNA or RNA-antisense complex and anchors it to the nitrocellulose filter at the site of deposition. Radiolabeled ligands (Ligand*) bound to immobilized aptamer RNAs at the center of the filter are detectable by phosphorimaging.
Figure 2.
Figure 2.
The RNA-DRaCALA method is specific and permits precise Kd measurement of ligand-aptamer binding. (A) RNA-DRaCALA assay on 0.5μM of biotinylated ilvE from T. oceani (To-B) or 3′-tagged T.oceani ilvE (To-T), M2 mutant T. oceani ilvE (M2-T), and D. hafniense ilvE (Dh-T) with 70 nM radiolabeled-ppGpp (32P-ppGpp) in the presence or absence of 1 μM Streptavidin and/or 1 μM biotinylated antisense (B-AS). RNA-B: biotinylated RNAs; RNA-T: tagged RNAs; B-AS: biotinylated antisense; Strep: Streptavidin. All RNA-DRaCALA were reproduced in at least three independent replicates. Average values are represented under each DRaCALA sample as a percentage of ligand bound (radioactive signal at the center of the filter) divided by the total amount of signal. CI: confidence intervals for the quantified values. (B) RNA-DRaCALA competition assay on 1 μM of To-B in the presence of 1 μM Streptavidin, 20 nM 32P-ppGpp, and 1 mM unlabeled ppGpp or GTP. Radiolabeled and unlabeled ligands were added simultaneously. (C) RNA-DRaCALA titration assay on concentrations of To-B ranging from 0.25 to 500 nM with 1 nM of 32P-ppGpp and 1 μM Streptavidin, compared to the biotinylated M2 mutant of T. oceani ilvE (M2-B), the negative control. (D) The results from (C) were quantified and fitted to a saturation binding curve, resulting in a Kd of 22.1 nM for this experiment. Error bars represent standard error obtained from three biological replicates of the experiment.
Figure 3.
Figure 3.
RNA-DRaCALA screen unveils a wide range of binding preferences to ppGpp and pppGpp in ykkC subtype 2a aptamers. (A) Subset of ykkC subtype 2a RNA-aptamer candidates selected for this screen. (B) RNA-DRaCALA screen of 0.5 μM 3′-tagged RNA-aptamer candidates in the presence of 1 μM biotinylated antisense DNAs, 1.5 μM Streptavidin, and 20 nM 32P-ppGpp or 32P-pppGpp. To-T and Dh-T were used as positive controls for the binding to both ligands, and M2-T was included as a negative control. (C) Quantitation of three independent biological replicates of the experiment shown in (B), represented as the fraction of radiolabeled ligand signal bound to the RNA aptamer candidate divided by the total radioactive signal, normalized to the control without an RNA candidate to account for background. Error bars correspond to 95% confidence intervals.
Figure 4.
Figure 4.
Determination of binding constants for representative ykkC subtype 2a aptamers. Binding curves and RNA-DRaCALA images for the C16 (A), C21 (B), C90 (C) and C101 (D) RNA aptamers. Titrations were performed with RNA concentrations ranging from 25 nM up to 500 nM or 1 μM with 10 nM 32P-ppGpp or 32P-pppGpp. Percent bound values shown are from three independent repeats. Results were fitted to a binding curve using the equation and described for Figure 1C. Binding constants (Kds) were inferred from these curves where appropriate.
Figure 5.
Figure 5.
Refined ppGpp- and pppGpp-binding RNA aptamer models. Consensus RNA aptamer sequences and secondary structures derived from the top 24 ppGpp binding aptamers (A) and the top 22 pppGpp binding aptamers (B), respectively, determined from the RNA-DRaCALA screen in Figure 3. Stem structures are annotated from P0 to P3; nucleotides involved in contacts with the ligand in the binding pocket, as determined from the crystal structure of an RNA aptamer-ppGpp complex (44), are circled in green (contacts with 3′ phosphates), blue (contacts with 5′ phosphates, direct or via a Mg2+ ion), or red (base pairing with (p)ppGpp). Compatible mutations are U-to-C or C-to-U substitutions in C-G/U-G base pairs, or A-to-G or G-to-A substitutions in A-U/G-U base pairs. Relevant motifs, also described in the text, are indicated, and circled: P1-ACA in orange (P1-RYN in panel A), P2-ACAC in purple and P3-P0-ss in teal. (C) Representation of the 3 most frequent configurations in which the P1-ACA motif was found in aptamers. P1-ACA was either embedded at the 3′-end of the P1 stem-loop (P1-ACA 0), shifted 1 nt downstream (P1-ACA + 1), or formed an extra A–U base pair represented by a dotted line, leaving no single stranded nt between P1 and P2 (P1-ACA 0/1). (D). Box plot analysis of % ppGpp or pppGpp bound to aptamers harboring the motif P1-ACA 0 (7 aptamers), P1-ACA + 1 (5 aptamers), or P1-ACA 0/1 (11 aptamers). Using P3-P0-ss sequences (Supplementary Table S1) and results presented in Figure 3 and Supplementary Figure S4 (for C94, C99 and C100), we defined consensus sequences for the P3-P0-ss motif for aptamers that bind to both ligands (E) or that prefer ppGpp (F). Sequence Logos were designed using the WebLogo server (https://weblogo.berkeley.edu/logo.cgi (58,59). Consensus sequences are also represented in their proposed single stranded conformation between P3 and P0 stems. The consensus sequences are 5′-(A)NARG or NAGG for (p)ppGpp binding or ppGpp-specificity, respectively, where R is a purine, and N is any nucleotide. The first position, shown in parentheses, corresponds to the position adjacent to the P3 stem in the five candidates with a 5 nt P3-P0-ss. Note that the secondary structure consensus models in (A) and (B) do not illustrate the variation in length of the P3-P0-ss sequences among the aptamers. (G) Box plot analysis of % ppGpp or pppGpp bound to aptamers with P1 stem-loops ranging from 41 to 45 nt long (13 aptamers) or with P1 stem loops longer than 45 nt (12 aptamers). (H) Box plot analysis of the ratio of ppGpp/pppGpp bound to each aptamer for aptamers with P1 stem loops ranging from 41 to 45 nt long and for P1 stem loops longer than 45 nt. Standard deviations (SD) are indicated, as well as the result of a Fisher test for differences in variance. For (D), (G) and (H), the inclusive median method was used to identify quartiles. For (D) and (G), average values are indicated for each category, as well as the results of a two tailed Student's t-test, with P-values < 0.05 (*) or < 0.0005 (***) or not significant (NS).
Figure 6.
Figure 6.
Proposed secondary structures for individual aptamers. Sequences and proposed secondary structure for the representative ykkC motif subtype 2a aptamers for which binding titrations were determined in Figure 4. These aptamers bind to both ppGpp and pppGpp (A) or bind specifically to either ppGpp (B, C) or pppGpp. (D) Aptamer candidate numbers and associated gene and species names are shown. Stem-loop numbers are indicated, and positions of interest are circled as in Figure 5.
Figure 7.
Figure 7.
Structural perspective on the contribution of various features to ligand specificity. (A) Secondary structure and sequence of the S. acidophilus ppGpp-aptamer described in (44), PDB ID 6dmc. Positions of interest are circled as in Figure 5. Zoomed-in views of the features P3-P0-ss (B–D), P2-ACAC (B–E) and P1-ACA (B) with RNA backbone shown in ribbon form respectively represented in blue for P0, yellow for P1, pink for P2, red for P3, teal for P3-P0-ss, purple for P2-ACAC and orange for P1-ACA. Bases and ppGpp are depicted in stick representation, and those of interest are represented in blue when they contact ppGpp 5′-phosphates directly (A-4) or via Mg2+ interactions (G-5), in green when they contact ppGpp 3′-phosphates (G-43, C-72 and A-96), in red for the C-70 base-pairing with ppGpp, and otherwise in the color of their respective region (P3-P0-ss in teal, P2-ACAC in purple and P1-ACA in orange, respectively). ppGpp is depicted in yellow and atomic colors. Dotted black lines represent distances equal to or shorter than 3.3 Å between two bases where they can form hydrogen bonds. In (C) and (D), the NH2 group of a hypothetical G-97 guanine was depicted in red and teal dotted lines, to show its proximity and potential interaction with C-70. Crystal structure figures were prepared using PyMol (http://pymol.org/).
Figure 8.
Figure 8.
Diversity and conservation of ykkC aptamers homologs. Phylogenetic tree of the ykkC family of aptamers analyzed in vitro and/or in silico in this study using the PhyloT software (http://phylot.biobyte.de/). Candidates from the list of 105 candidates (25) that were tested in vitro appear as solid black lines with C numbers. New homologs found using a two-step in silico protein homology/aptamer search appear with a gene name tag and dotted lines in the color corresponding to their best fitness score (see legends), or by a solid black line if tested in vitro. Other homologs found using a one-step RNA-blast appear as dotted lines. A line can refer to multiple candidates in the case they are found in the same species. Binding preferences for ppGpp or for pppGpp or for both ligands are indicated by blue or red circles or by an X for weak or no binding.

Similar articles

Cited by

References

    1. Ellington A.D., Szostak J.W.. Selection in vitro of single-stranded DNA molecules that fold into specific ligand-binding structures. Nature. 1992; 355:850–852. - PubMed
    1. Winkler W., Nahvi A., Breaker R.R.. Thiamine derivatives bind messenger RNAs directly to regulate bacterial gene expression. Nature. 2002; 419:952–956. - PubMed
    1. Winkler W.C., Nahvi A., Roth A., Collins J.A., Breaker R.R.. Control of gene expression by a natural metabolite-responsive ribozyme. Nature. 2004; 428:281–286. - PubMed
    1. Nahvi A., Sudarsan N., Ebert M.S., Zou X., Brown K.L., Breaker R.R.. Genetic control by a metabolite binding mRNA. Chem. Biol. 2002; 9:1043–1049. - PubMed
    1. Mironov A.S., Gusarov I., Rafikov R., Lopez L.E., Shatalin K., Kreneva R.A., Perumov D.A., Nudler E.. Sensing small molecules by nascent RNA: a mechanism to control transcription in bacteria. Cell. 2002; 111:747–756. - PubMed

Publication types