

Transcriptomic analysis of the innate immune response to in vitro transfection of plasmid DNA
- PMID: 36618265
- PMCID: PMC9800263
- DOI: 10.1016/j.omtn.2022.11.025
Transcriptomic analysis of the innate immune response to in vitro transfection of plasmid DNA
Abstract
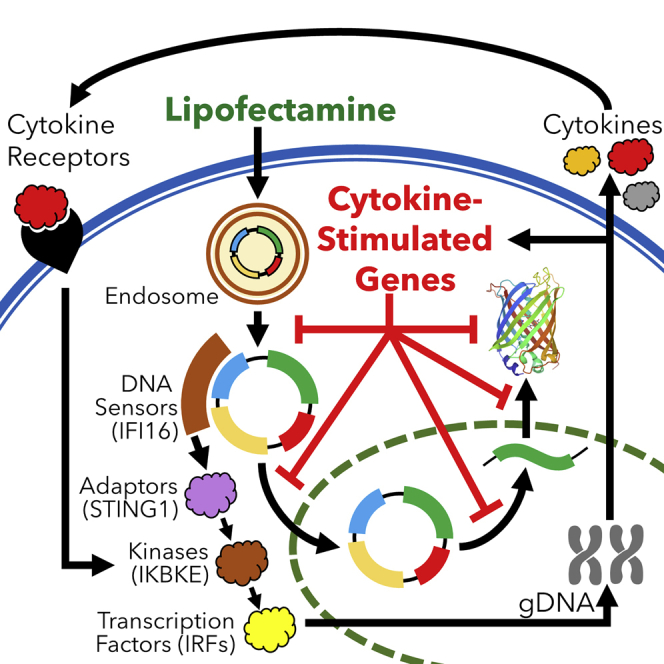
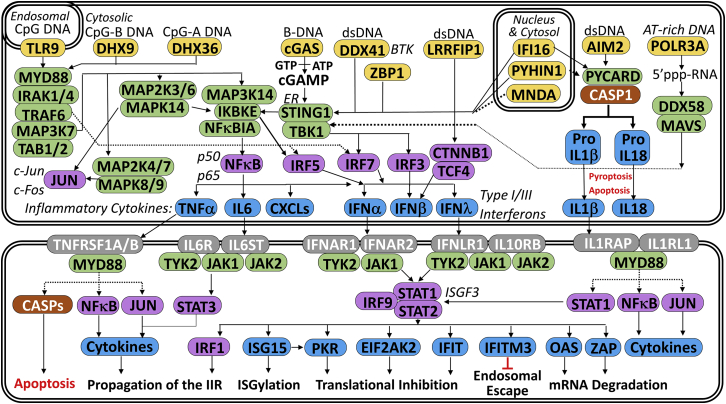
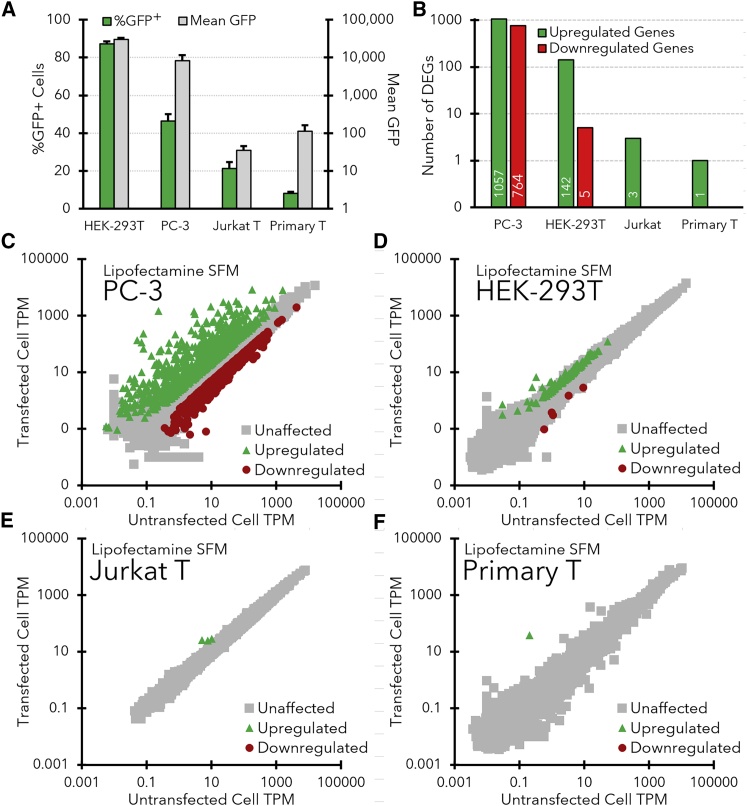
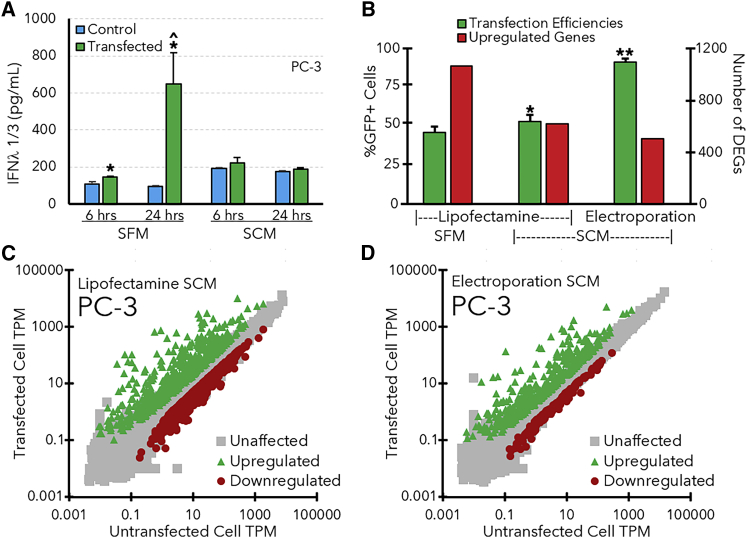
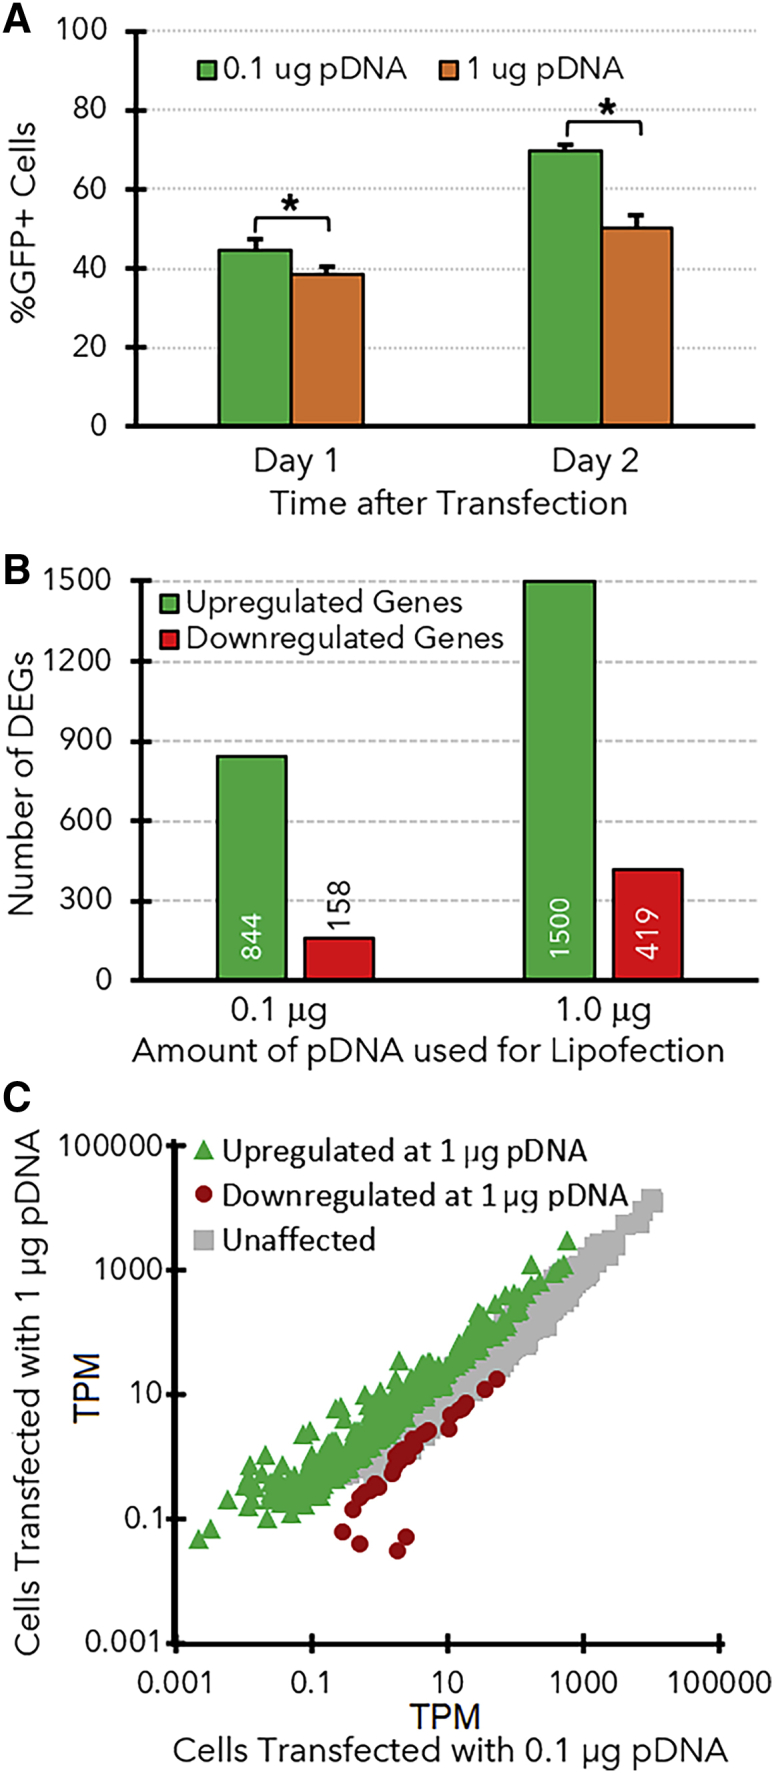
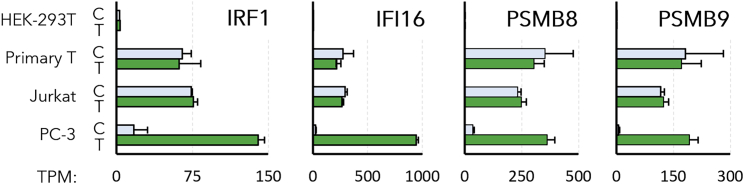
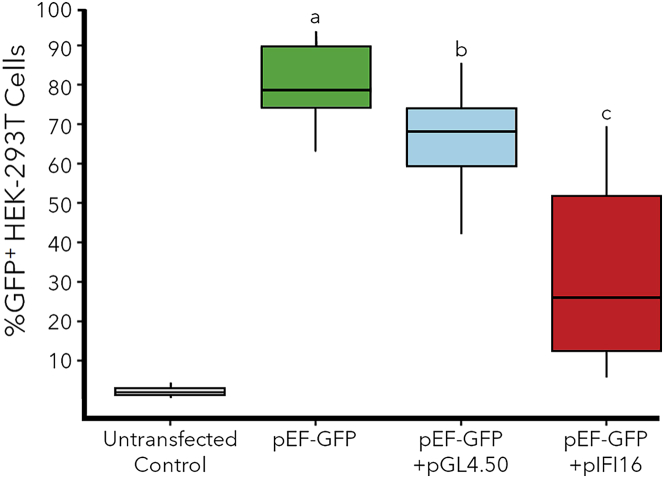
The innate immune response to cytosolic DNA is intended to protect the host from viral infections, but it can also inhibit the delivery and expression of therapeutic transgenes in gene and cell therapies. The goal of this work was to use mRNA sequencing to identify genes that may influence transfection efficiency in four different cell types (PC-3, Jurkat, HEK-293T, and primary T cells). The highest transfection efficiency was observed in HEK-293T cells, which upregulated only 142 genes with no known antiviral functions after transfection with lipofectamine. Lipofection upregulated 1,057 cytokine-stimulated genes (CSGs) in PC-3 cells, which exhibited a significantly lower transfection efficiency. However, when PC-3 cells were transfected in serum-containing media or electroporated, the observed transfection efficiencies were significantly higher while the expression levels of cytokines and CSGs decreased. In contrast, lipofection of Jurkat and primary T cells only upregulated a few genes, but several of the antiviral CSGs that were absent in HEK-293T cells and upregulated in PC-3 cells were observed to be constitutively expressed in T cells, which may explain the relatively low Lipofection efficiencies observed with T cells (8%-21% GFP+). Indeed, overexpression of one CSG (IFI16) significantly decreased transfection efficiency in HEK-293T cells.
Keywords: IFI16; IKBKE; MT: Oligonucleotides: Therapies and applications; MYD88; STING; cytokine-stimulated genes; cytokines; innate immune response; plasmid.
© 2022 The Author(s).
Conflict of interest statement
The authors declare that there is no conflict of interest.
Figures
Similar articles
-
Delivery of molecular cargoes in normal and cancer cell lines using non-viral delivery systems.Biotechnol Lett. 2018 Jun;40(6):923-931. doi: 10.1007/s10529-018-2551-2. Epub 2018 Apr 9. Biotechnol Lett. 2018. PMID: 29633093
-
Nonviral gene delivery to T cells with Lipofectamine LTX.Biotechnol Bioeng. 2021 Apr;118(4):1693-1706. doi: 10.1002/bit.27686. Epub 2021 Feb 2. Biotechnol Bioeng. 2021. PMID: 33480049
-
Electrotransfection and lipofection show comparable efficiency for in vitro gene delivery of primary human myoblasts.J Membr Biol. 2015 Apr;248(2):273-83. doi: 10.1007/s00232-014-9766-5. Epub 2014 Dec 23. J Membr Biol. 2015. PMID: 25534347
-
Transcriptome Analysis Reveals a Signature Profile for Tick-Borne Flavivirus Persistence in HEK 293T Cells.mBio. 2016 May 24;7(3):e00314-16. doi: 10.1128/mBio.00314-16. mBio. 2016. PMID: 27222466 Free PMC article.
-
Different Influences of Lipofection and Electrotransfection on In Vitro Gene Delivery to Primary Cultured Cortex Neurons.Pain Physician. 2016 Mar;19(3):189-96. Pain Physician. 2016. PMID: 27008293
Cited by
-
A Host Cell Vector Model for Analyzing Viral Protective Antigens and Host Immunity.Int J Mol Sci. 2025 Aug 2;26(15):7492. doi: 10.3390/ijms26157492. Int J Mol Sci. 2025. PMID: 40806621 Free PMC article.
-
Investigating dynamics of lentiviral vector secretion from HEK293T producer cells using a fractionated perfusion system.Biotechnol J. 2024 Jan;19(1):e2300097. doi: 10.1002/biot.202300097. Epub 2023 Sep 21. Biotechnol J. 2024. PMID: 37718481 Free PMC article.
-
Precondensed Plasmid DNA Enhances CAR‑T Cell Generation via Lipid Nanoparticles.ACS Omega. 2025 Jul 4;10(27):29804-29814. doi: 10.1021/acsomega.5c04308. eCollection 2025 Jul 15. ACS Omega. 2025. PMID: 40686987 Free PMC article.
-
Diverse effects of coronavirus-defective viral genomes on the synthesis of IFNβ and ISG15 mRNAs and coronavirus replication.Virol J. 2025 Feb 14;22(1):37. doi: 10.1186/s12985-025-02654-5. Virol J. 2025. PMID: 39953551 Free PMC article.
-
Induction of translation-suppressive G3BP1+ stress granules and interferon-signaling cGAS condensates by transfected plasmid DNA.Hlife. 2025 Jan;3(1):21-37. doi: 10.1016/j.hlife.2024.11.005. Epub 2024 Dec 24. Hlife. 2025. PMID: 40078969 Free PMC article.
References
-
- Ginn S.L., Amaya A.K., Alexander I.E., Edelstein M., Abedi M.R. Gene therapy clinical trials worldwide to 2017: an update. J. Gene Med. 2018;20:e3015. - PubMed
-
- Darrow J.J. Luxturna: FDA documents reveal the value of a costly gene therapy. Drug Discov. Today. 2019;24:949–954. - PubMed
-
- Ali S., Kjeken R., Niederlaender C., Markey G., Saunders T.S., Opsata M., Moltu K., Bremnes B., Grønevik E., Muusse M., et al. The European medicines agency review of kymriah (Tisagenlecleucel) for the treatment of acute lymphoblastic leukemia and diffuse large B-cell lymphoma. Oncol. 2020;25:e321–e327. - PMC - PubMed
-
- Zheng P.P., Kros J.M., Li J. Approved CAR T cell therapies: ice bucket challenges on glaring safety risks and long-term impacts. Drug Discov. Today. 2018;23:1175–1182. - PubMed
LinkOut - more resources
Full Text Sources
Molecular Biology Databases
Research Materials
Miscellaneous
