. 2022 Dec 21:16:1057439.
doi: 10.3389/fncom.2022.1057439. eCollection 2022.

On the similarities of representations in artificial and brain neural networks for speech recognition

Affiliations

On the similarities of representations in artificial and brain neural networks for speech recognition

Cai Wingfield et al. Front Comput Neurosci. .

Abstract

Introduction: In recent years, machines powered by deep learning have achieved near-human levels of performance in speech recognition. The fields of artificial intelligence and cognitive neuroscience have finally reached a similar level of performance, despite their huge differences in implementation, and so deep learning models can-in principle-serve as candidates for mechanistic models of the human auditory system.

Methods: Utilizing high-performance automatic speech recognition systems, and advanced non-invasive human neuroimaging technology such as magnetoencephalography and multivariate pattern-information analysis, the current study aimed to relate machine-learned representations of speech to recorded human brain representations of the same speech.

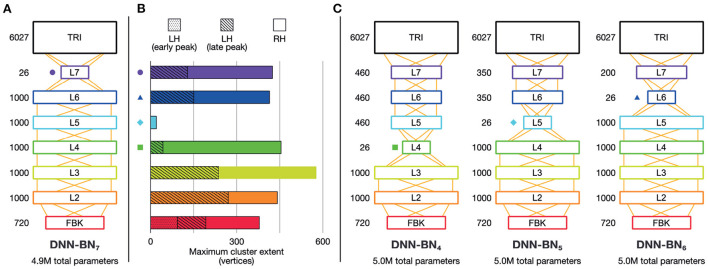
Results: In one direction, we found a quasi-hierarchical functional organization in human auditory cortex qualitatively matched with the hidden layers of deep artificial neural networks trained as part of an automatic speech recognizer. In the reverse direction, we modified the hidden layer organization of the artificial neural network based on neural activation patterns in human brains. The result was a substantial improvement in word recognition accuracy and learned speech representations.

Discussion: We have demonstrated that artificial and brain neural networks can be mutually informative in the domain of speech recognition.

Keywords: auditory cortex; automatic speech recognition; deep neural network; representational similarity analysis; speech recognition.


Conflict of interest statement

The authors declare that the research was conducted in the absence of any commercial or financial relationships that could be construed as a potential conflict of interest.

Figures

Figure 1
Figure 1
Schematic of the overall procedure. (A–D) Schematic representation of our automatic speech recognition system. Our ASR model is a hybrid DNN–HMM system built with HTK (Young et al., ; Zhang and Woodland, 2015a). (A) An acoustic vector is built from a window of recorded speech. (B) This is used as an input for a DNN acoustic model which estimates posterior probabilities of triphonetic units. Numbers above the figure indicate the size of each layer. Hidden layer L7 is the bottleneck layer for DNN-BN7. (C) The triphone posteriors (TRI) are converted into log likelihoods, and used in a set of phonetic HMMs. (D) A decoder computes word identities from the HMM states. (E–G) Computing dynamic RDMs. (E) A pair of stimuli is presented to each subject, and the subjects' brain responses are recorded over time. The same stimuli are processed using HTK, and the hidden-layer activations recorded over time. (F) The spatiotemporal response pattern within a patch of each subject's cortex is compared using correlation distance. The same comparison is made between hidden-layer activation vectors. (G) This is repeated for each pair of stimuli, and distances entered into a pairwise comparison matrix called a representational dissimilarity matrix (RDM). As both brain response and DNN response evolve over time, additional frames of the dynamic RDM are computed.
Figure 2
Figure 2
Arrangement of phonetic space represented in DNN-BN7. (A) Davies–Bouldin clustering indices for hidden-layer representations. Each plot shows the Davies–Bouldin clustering index for the average hidden-layer representation for each phonetic segment of each stimulus. Lower values indicate better clustering. Indices were computed by labeling each segment by its phonetic label (top right panel), or by place, manner, frontness, or closeness features (other panels). (B) Average activation of phones for L7 Sammon non-linear multidimensional scaling (MDS) of average pattern of activation over phones, annotated with features describing place and position of articulation. (C) The same MDS arrangement annotated with features describing manner of articulation.
Figure 3
Figure 3
Matching model and data RDMs at systematic latencies. (A) Both DNN and brain representations change throughout the time-course of the stimulus, and are aligned to the start of the stimulus at t = 0. Some amount of time (“processing latency”) elapses between the sound reaching the participants' eardrums and the elicited response in auditory cortex. Thus, the brain representations recorded at time t were elicited by the stimulus earlier in time. (B) For a given hypothesized processing latency, we RDMs from DNN layers and brain recordings are matched up, and an overall level of fit is computed. This modeled latency is systematically varied, the resultant level of fit thereby indicating how well the DNN's representation matches the brain's at that latency.
Figure 4
Figure 4
Clusters of significant fit of hidden-layer models to left-hemisphere EMEG data. (A) Location of region of interest mask for auditory cortex. (B) Maps describing fit of DNN layer models to EMEG data. Latency represents the time taken for the brain to exhibit neural representations that fit the DNN model prediction. All maps thresholded at p < 0.01 (corrected). (C) Line graphs showing the time-courses of cluster extents for each layer which showed significant fit.
Figure 5
Figure 5
Brain-informed DNN design refinement. (A) Original DNN-BN7 design. Numbers beside layers indicate number of nodes. (B) Maximum cluster extent indicates the degree of fit with EMEG brain representations. Where there is more than one spatiotemporally discontinuous cluster, we sum their contributions, with different segments indicated by different shading. Colored shapes on the DNN-layer axis and in other panels indicate the placement of the bottleneck layer for DNN-BN4—7. (C) Candidates for adjusted DNN design: DNN-BN4 (bottleneck at L4), DNN-BN5 (bottleneck at L5) and DNN-BN6 (bottleneck at L6).
Figure 6
Figure 6
(A) Davies–Bouldin clustering indices for hidden-layer representations. Each plot shows the Davies–Bouldin clustering index for the average hidden-layer representation for each phonetic segment of each stimulus. Lower values indicate better clustering. Indices were computed by labeling each segment by its phonetic label (top right panel), or by place, manner, frontness, or closeness features (other panels). Colored shapes on the DNN-layer axis indicate the placement of the bottleneck layer for each System. Inset axes show clustering indices for bottleneck-layers only. Each plot shows the clustering index for the average bottleneck-layer representation for each phonetic segment of each stimulus. Indices were computed by labeling each segment by its phonetic label (top right), or by place, manner, frontness, or closeness features. Colored shapes on the DNN-layer axis indicate the placement of the bottleneck layer for each System. (B) WERs for each DNN system. Upper panel shows WERs on the MGB Dev set. Lower panel shows WERs for the stimuli.

References

    1. Arsenault J. S., Buchsbaum B. R. (2015). Distributed neural representations of phonological features during speech perception. J. Neurosci. 35, 634–642. 10.1523/JNEUROSCI.2454-14.2015 - DOI - PMC - PubMed
    1. Baevski A., Zhou Y., Mohamed A., Auli M. (2020). “wav2vec 2.0: a framework for self-supervised learning of speech representations,” in Proceedings of the 34th International Conference on Neural Information Processing Systems: NIPS'20, Vol. 33 (Vancouver, BC: ), 12449–12460.
    1. Baumann S., Petkov C. I., Griffiths T. D. (2013). A unified framework for the organization of the primate auditory cortex. Front. Syst. Neurosci. 7, 11. 10.3389/fnsys.2013.00011 - DOI - PMC - PubMed
    1. Bell P., Gales M., Hain T., Kilgour J., Lanchantin P., Liu X., et al. . (2015). “The MGB challenge: evaluating multi-genre broadcast media transcription,” in Proc. ASRU (Scotsdale, AZ: ), 687–693. 10.1109/ASRU.2015.7404863 - DOI
    1. Bishop C. (2006). Pattern Recognition and Machine Learning. New York, NY: Springer.

LinkOut - more resources