

Temporal networks in biology and medicine: a survey on models, algorithms, and tools
- PMID: 36618274
- PMCID: PMC9803903
- DOI: 10.1007/s13721-022-00406-x
Temporal networks in biology and medicine: a survey on models, algorithms, and tools
Abstract
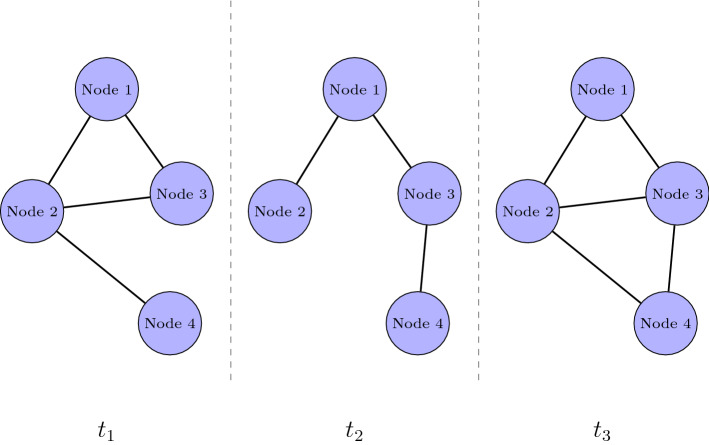
The use of static graphs for modelling and analysis of biological and biomedical data plays a key role in biomedical research. However, many real-world scenarios present dynamic behaviours resulting in both node and edges modification as well as feature evolution. Consequently, ad-hoc models for capturing these evolutions along the time have been introduced, also referred to as dynamic, temporal, time-varying graphs. Here, we focus on temporal graphs, i.e., graphs whose evolution is represented by a sequence of time-ordered snapshots. Each snapshot represents a graph active in a particular timestamp. We survey temporal graph models and related algorithms, presenting fundamentals aspects and the recent advances. We formally define temporal graphs, focusing on the problem setting and we present their main applications in biology and medicine. We also present temporal graph embedding and the application to recent problems such as epidemic modelling. Finally, we further state some promising research directions in the area. Main results of this study include a systematic review of fundamental temporal network problems and their algorithmic solutions considered in the literature, in particular those having application in computational biology and medicine. We also include the main software developed in this context.
© The Author(s), under exclusive licence to Springer-Verlag GmbH Austria, part of Springer Nature 2022, Springer Nature or its licensor (e.g. a society or other partner) holds exclusive rights to this article under a publishing agreement with the author(s) or other rightsholder(s); author self-archiving of the accepted manuscript version of this article is solely governed by the terms of such publishing agreement and applicable law.
Conflict of interest statement
Conflict of interestAuthors declare that they have no conflict of interest.
Figures


References
-
- Akrida EC, Mertzios GB, Spirakis PG, Zamaraev V. Temporal vertex cover with a sliding time window. J Comput Syst Sci. 2020;107:108–123. doi: 10.1016/j.jcss.2019.08.002. - DOI
-
- Albert-László B. Bursts: the hidden patterns behind everything we do from your e-mail to bloody crusades. Penguin; 2010.
-
- Alexei V. Temporal networks. Springer; 2013. Spreading dynamics following bursty activity patterns; pp. 161–174.
Publication types
LinkOut - more resources
Full Text Sources