. 2022 Dec 21:13:1064084.
doi: 10.3389/fimmu.2022.1064084. eCollection 2022.

Chicken CSF2 and IL-4-, and CSF2-dependent bone marrow cultures differentiate into macrophages over time

Affiliations

Chicken CSF2 and IL-4-, and CSF2-dependent bone marrow cultures differentiate into macrophages over time

Dominika Borowska et al. Front Immunol. .

Abstract

Chicken bone marrow-derived macrophages (BMMΦ) and dendritic cells (BMDC) are utilized as models to study the mononuclear phagocytic system (MPS). A widely used method to generate macrophages and DC in vitro is to culture bone marrow cells in the presence of colony-stimulating factor-1 (CSF1) to differentiate BMMΦ and granulocyte-macrophage-CSF (GM-CSF, CSF2) and interleukin-4 (IL-4) to differentiate BMDC, while CSF2 alone can lead to the development of granulocyte-macrophage-CSF-derived DC (GMDC). However, in chickens, the MPS cell lineages and their functions represented by these cultures are poorly understood. Here, we decipher the phenotypical, functional and transcriptional differences between chicken BMMΦ and BMDC along with examining differences in DC cultures grown in the absence of IL-4 on days 2, 4, 6 and 8 of culture. BMMΦ cultures develop into a morphologically homogenous cell population in contrast to the BMDC and GMDC cultures, which produce morphologically heterogeneous cell cultures. At a phenotypical level, all cultures contained similar cell percentages and expression levels of MHCII, CD11c and CSF1R-transgene, whilst MRC1L-B expression decreased over time in BMMΦ. All cultures were efficiently able to uptake 0.5 µm beads, but poorly phagocytosed 1 µm beads. Little difference was observed in the kinetics of phagosomal acidification across the cultures on each day of analysis. Temporal transcriptomic analysis indicated that all cultures expressed high levels of CSF3R, MERTK, SEPP1, SPI1 and TLR4, genes associated with macrophages in mammals. In contrast, low levels of FLT3, XCR1 and CAMD1, genes associated with DC, were expressed at day 2 in BMDC and GMDC after which expression levels decreased. Collectively, chicken CSF2 + IL-4- and CSF2-dependent BM cultures represent cells of the macrophage lineage rather than inducing conventional DC.

Keywords: bone marrow cell cultures; chicken; dendritic cell; macrophage; transcriptome.


Conflict of interest statement

The authors declare that the research was conducted in the absence of any commercial or financial relationships that could be construed as a potential conflict of interest.

Figures

Figure 1
Figure 1
CSF1 induces a morphologically homogenous BM cell cultures in contrast to BM treated with CSF2 + IL-4 or CSF2 alone. (A) Representative DIC images of chicken BM cells treated with CSF2 + IL-4 (BMDC), CSF2 (GMDC) or CSF1 (BMMΦ) on day 4 of culture. (B) Yellow triangles indicate veiled cells (C) white triangles indicate cells with numerous intracellular vacuoles, blue triangles shows small round cells and orange triangles show large cells and red triangles show elongated cells. Images of three independent BM cultures derived from 5-week-old chickens. Scale bar represents 100 µm in A and 50 µm in B and C.
Figure 2
Figure 2
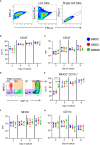
Phenotypic analysis of chicken BMDC, GMDC and BMMΦ on days 2, 4, 6 and 8 of culture. (A) Representative flow plots of SSC-A and FSC-A and live and single cell gating strategy applied to all cultures at each day of analysis. (B) The percentage of CD45+ cells and (C) median fluorescence intensity (MFI) levels of CD45 expression live, single cells in BMDC (blue), GMDC (red) and BMMΦ (green) on days 2, 4, 6 and 8. (D) Dot plots representing FMO-1 control gating strategy on live, single cells for the analysis of MHCII+ CD11c+ (G3) cell percentages and (E) MFI of (F) MHCII and (G) CD11c expression levels in G4 across each culture on days 2, 4, 6 and 8. Data represents the median (± range). From each bird (n=6), BMDC, GMDC and BMMΦ were generated. Data represents two independent experiments (n=3 per experiment, open & closed circles). Statistical significant differences between cultures on day of analysis are indicated by ****p<0.001.
Figure 3
Figure 3
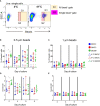
Phenotypic analysis of MHCII+ CD11c+ subpopulations in chicken BMDC, GMDC and BMMΦ cultures on days 2, 4, 6 and 8. The cell percentages and MFI of (A, B) CSF1R-tg, (C, D) MRC1L-B and (E, F) CD40 in the MHCII+ CD11c+ subpopulations in BMDC (blue), GMDC (red) and BMMΦ (green) on days 2, 4, 6 and 8. Data represents the median (± range). From each bird (n=6), BMDC, GMDC and BMMΦ were generated. Data represents two independent experiments (n=3 per experiment, open & closed circles). Statistical significant differences analyzed between cultures on day of analysis are indicated by *p<0.05.
Figure 4
Figure 4
Endocytic activity of BMDC, GMDC and BMMΦ cultures. BMDC (blue), GMDC (red) and BMMΦ (green) were incubated with 0.5 µm or 1 µm fluorescent beads at 41°C (circles) or 4°C (triangles) for 2 h on days 2, 4, 6 and 8 of culture and phagocytosis was analyzed by flow cytometry. (A) Representative flow plots of the gating strategy to determine specific bead uptake using the cells treated at 4°C and applied to the cells treated at 41°C. An all bead+ gate (G1) and a gate for cells with a single bead (G2) were applied. (B) The percentage of 0.5 µm bead+ cells; (C) and 1 µm bead+ cells; (D) the number of 0.5 µm beads per cell; (E) the number of 1 µm beads per cell; The number of beads per cell was calculated by dividing MFI of cells in G1 by cells in G2. Data represents the median (± range). From each bird (n=6), BMDC, GMDC and BMMΦ were generated. Data represents two independent experiments (n=3 per experiment, open & closed circles). Significant differences are indicated by *p <0.05.
Figure 5
Figure 5
Real-time kinetics of uptake and phagosomal acidification using pHrodo labelled zymosan bioparticles. (A) Representative flow plots of the gating strategy. Gates were applied to the cells treated with the actin polymerization inhibitor, Cytochalasin D (CytoD), as negative controls. (B) MFI of zymosan in CytoD treated (rectangle) or untreated (circles) BMDC (blue), GMDC (red) and BMMΦ (green) on days 2, 4, 6 and 8 of culture by flow cytometry. Data represents the median (± range). From each bird (n=6), BMDC, GMDC and BMMΦ were generated. Data represents two independent experiments (n=3 per experiment, open & closed circles). (C–F) Real time kinetics of BMDC, GMDC and BMMΦ phagosomal acidification 15 min, and at every hour up to 18 h post-treatment with zymosan bioparticles. Data are represented as mean ( ± SD) of three biological replicates normalized to background fluorescence of cells treated with CytoD.
Figure 6
Figure 6
BMDC and GMDC produce high NO levels post-LPS treatment. BM cultures were stimulated on days 2, 4, 6 and 8 with LPS from E. coli (circles) or untreated (Mock, rectangles). NO levels in cell supernatant were analyzed 48 h post-treatment using Griess reaction. Data represents the median (± range). From each bird (n=6), BMDC, GMDC and BMMΦ were generated. Data represents two independent experiments (n=3 per experiment, open & closed circles). Significant differences between the cultures on the day of stimulation are indicated by * p<0.05 and ****p<0.001.
Figure 7
Figure 7
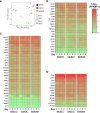
Chicken bone marrow cultures are enriched for monocyte/macrophages related gene signatures. (A) PCA of global gene expression profiles of BM cultures on days 2, 4, 6 and 8 of culture. Heat maps of gene expression levels of (B) core macrophage genes; (C) monocyte/macrophages related genes; (D) myeloid effector/receptor genes and lineage related transcription factors in BMDC, GMDC and BMMΦ at days 2, 4, 6 and 8 of culture. Heat maps are represented as the median of Log10 transformed Fragments Per Kilobase of transcript per Million mapped reads (FPKM) values from three independent biological replicates on each day from each culture. High reads shown in red and low reads in green.
Figure 8
Figure 8
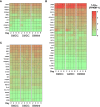
Chicken BM cultures are not enriched for DC related transcripts. Heat maps of gene expression levels of (A) pDC; (B) cDC and (C) core DC markers. Heat maps are represented as the median of Log10 transformed Fragments Per Kilobase of transcript per Million mapped reads (FPKM) values from three independent biological replicates on each day from each culture. High reads shown in red and low reads in green.
Figure 9
Figure 9
Gene-gene network graphs. (A) Sample-sample network graph. The graph is colored based on experimental groups and shows 3 clusters (A–C) comprised of 11 separate clusters (1-11). Each sphere (node) represents a gene, and lines between them (edges) show Pearson correlations between them of ≥0.95. Primary separation of samples is based on culture type. (B) Gene-gene network graphs demonstrating the expression pattern of the genes within the 11 clusters (1-11). The culture type and day of culture are denoted by the key at the base of the figure and used under each graph.

References

    1. T'Jonck W, Guilliams M, Bonnardel J. Niche signals and transcription factors involved in tissue-resident macrophage development. Cell Immunol (2018) 330:43–53. doi: 10.1016/j.cellimm.2018.02.005 - DOI - PMC - PubMed
    1. Inaba K, Inaba M, Romani N, Aya H, Deguchi M, Ikehara S, et al. . Generation of Large numbers of dendritic cells from mouse bone marrow cultures supplemented with Granulocyte/Macrophage colony-stimulating factor. J Exp Med (1992) 176(6):1693–702. doi: 10.1084/jem.176.6.1693 - DOI - PMC - PubMed
    1. Swiecki M, Gilfillan S, Vermi W, Wang Y, Colonna M. Plasmacytoid dendritic cell ablation impacts early interferon responses and antiviral nk and Cd8(+) T cell accrual. Immunity (2010) 33(6):955–66. doi: 10.1016/j.immuni.2010.11.020 - DOI - PMC - PubMed
    1. Stanley ER, Chen DM, Lin HS. Induction of macrophage production and proliferation by a purified colony stimulating factor. Nature (1978) 274(5667):168–70. doi: 10.1038/274168a0 - DOI - PubMed
    1. Lardon F, Snoeck HW, Berneman ZN, Van Tendeloo VF, Nijs G, Lenjou M, et al. . Generation of dendritic cells from bone marrow progenitors using gm-csf, tnf-alpha, and additional cytokines: Antagonistic effects of il-4 and ifn-gamma and selective involvement of tnf-alpha receptor-1. Immunology (1997) 91(4):553–9. doi: 10.1046/j.1365-2567.1997.00295.x - DOI - PMC - PubMed

Publication types

MeSH terms

Substances