

US trends in social isolation, social engagement, and companionship ⎯ nationally and by age, sex, race/ethnicity, family income, and work hours, 2003-2020
- PMID: 36618547
- PMCID: PMC9811250
- DOI: 10.1016/j.ssmph.2022.101331
US trends in social isolation, social engagement, and companionship ⎯ nationally and by age, sex, race/ethnicity, family income, and work hours, 2003-2020
Abstract
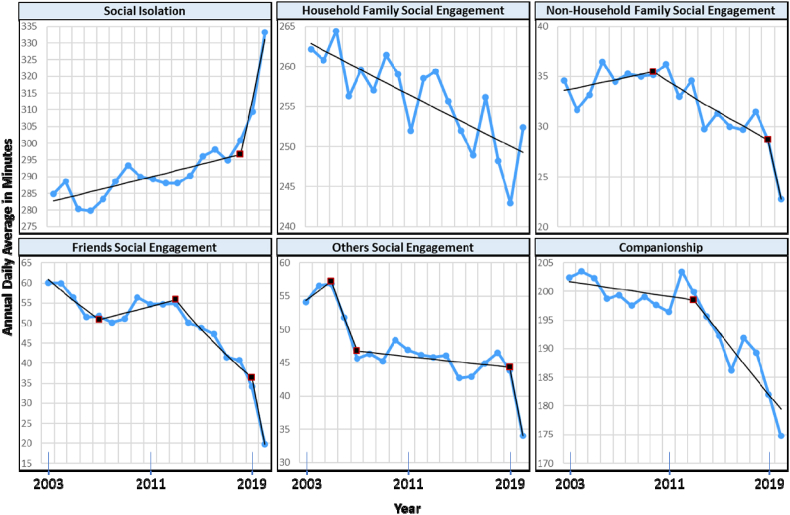
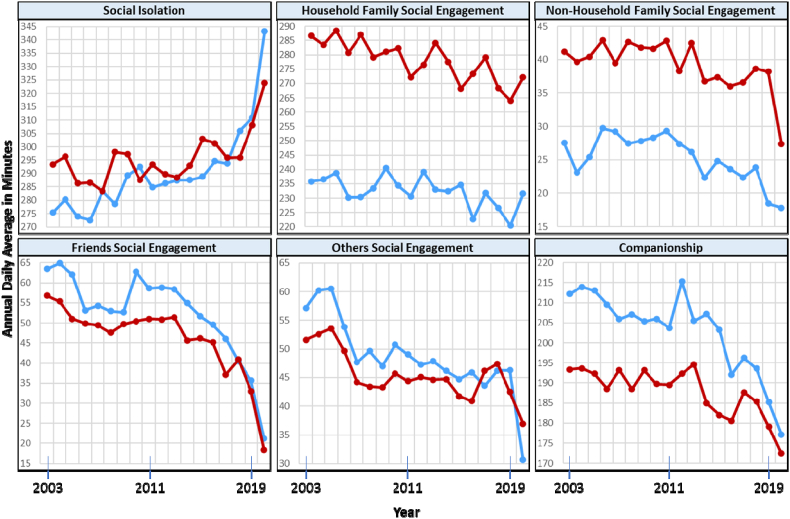
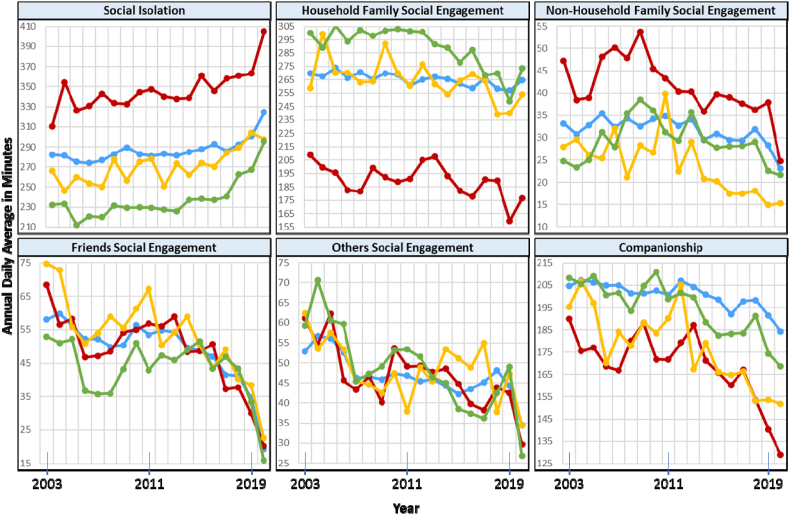
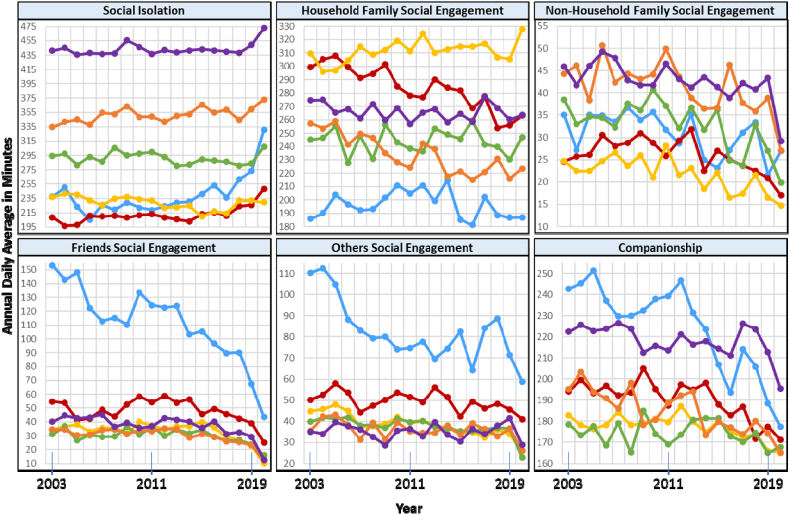
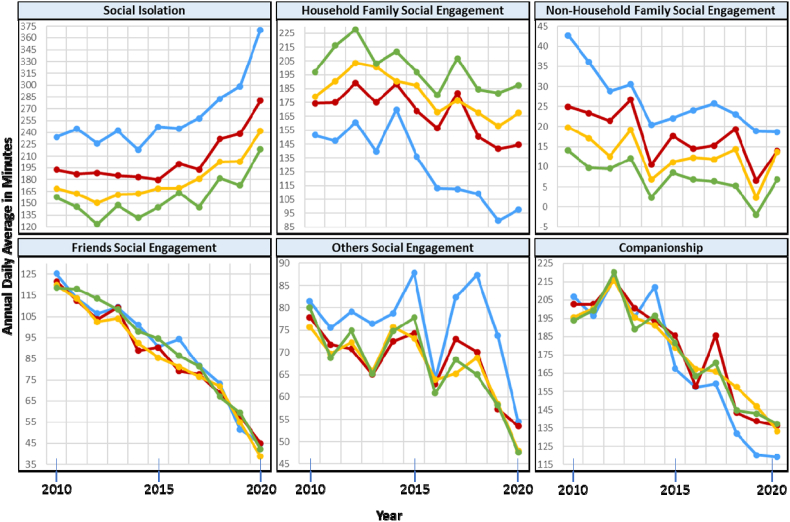
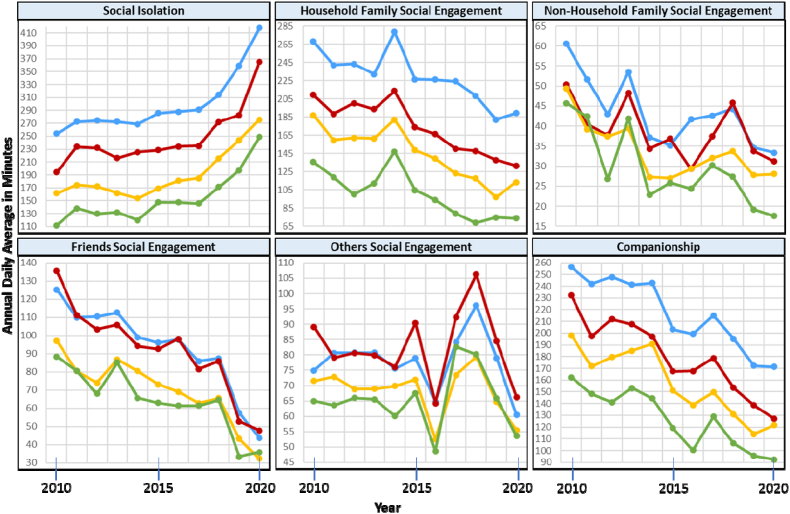
Social connectedness is essential for health and longevity, while isolation exacts a heavy toll on individuals and society. We present U.S. social connectedness magnitudes and trends as target phenomena to inform calls for policy-based approaches to promote social health. Using the 2003-2020 American Time Use Survey, this study finds that, nationally, social isolation increased, social engagement with family, friends, and 'others' (roommates, neighbors, acquaintances, coworkers, clients, etc.) decreased, and companionship (shared leisure and recreation) decreased. Joinpoint analysis showed that the pandemic exacerbated upward trends in social isolation and downward trends in non-household family, friends, and 'others' social engagement. However, household family social engagement and companionship showed signs of progressive decline years prior to the pandemic, at a pace not eclipsed by the pandemic. Work hours emerged as a structural constraint to social engagement. Sub-groups allocated social engagement differently across different relationship roles. Social engagement with friends, others, and in companionship plummeted for young Americans. Black Americans experienced more social isolation and less social engagement, overall, relative to other races. Hispanics experienced much less social isolation than non-Hispanics. Older adults spent more time in social isolation, but also relatively more time in companionship. Women spent more time with family while men spent more time with friends and in companionship. And, men's social connectedness decline was steeper than for women. Finally, low-income Americans are more socially engaged with 'others' than those with higher income. We discuss potential avenues of future research and policy initiatives that emerge from our findings.
Keywords: American Time Use Survey; Family; Friends; Health disparities.
© 2022 Published by Elsevier Ltd.
Conflict of interest statement
We have no conflicts of interest.
Figures
References
-
- Antonucci T.C., Fiori K.L., Birditt K., Jackey L.M. In: Lerner R.M., Lamb M.E., Freund A.M., editors. Vol. 2. Wiley; Hoboken, NJ: 2010. Convoys of social relations: Integrating life-span and life-course perspectives; pp. 434–473. (The handbook of life-span development).
LinkOut - more resources
Full Text Sources
