. 2022 Dec 22:13:1027688.
doi: 10.3389/fpls.2022.1027688. eCollection 2022.

Gibberellic acid sensitive dwarf encodes an ARPC2 subunit that mediates gibberellic acid biosynthesis, effects to grain yield in rice

Affiliations

Gibberellic acid sensitive dwarf encodes an ARPC2 subunit that mediates gibberellic acid biosynthesis, effects to grain yield in rice

Tae Young Um et al. Front Plant Sci. .

Abstract

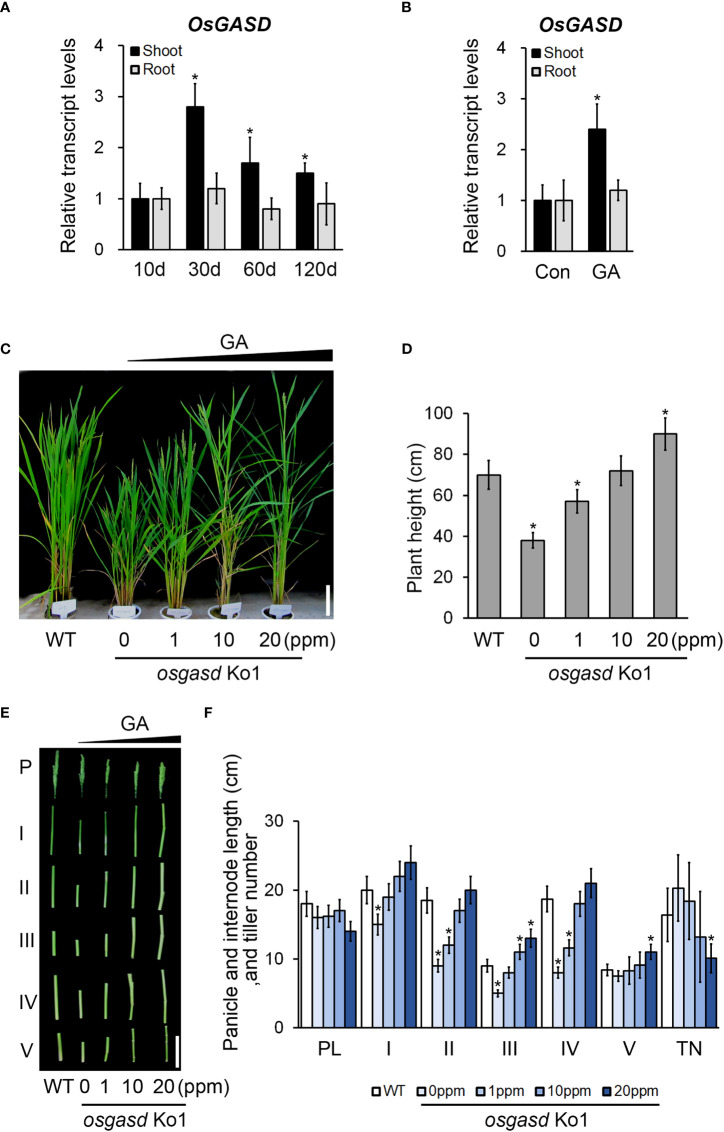
The plant hormone gibberellic acid (GA) is important for plant growth and productivity. Actin-related proteins (ARPs) also play central roles in plant growth, including cell elongation and development. However, the relationships between ARPs and GA signaling and biosynthesis are not fully understood. Here, we isolated OsGASD, encoding an ARP subunit from rice (Oryza sativa), using the Ac/Ds knockout system. The osgasd knockout (Ko) mutation reduced GA3 content in shoots as well as plant growth and height. However, GA application restored the plant height of the osgasd Ko mutant to a height similar to that of the wild type (WT). Rice plants overexpressing OsGASD (Ox) showed increased plant height and grain yield compared to the WT. Transcriptome analysis of flag leaves of OsGASD Ox and osgasd Ko plants revealed that OsGASD regulates cell development and the expression of elongation-related genes. These observations suggest that OsGASD is involved in maintaining GA homeostasis to regulate plant development, thereby affecting rice growth and productivity.

Keywords: Oryza sativa; actin-related protein; gibberellic acid; grain yield; rice growth.


Conflict of interest statement

Author BC was employed by NBIT Co., Ltd. The remaining authors declare that the research was conducted in the absence of any commercial or financial relationships that could be construed as a potential conflict of interest.

Figures

Figure 1
Figure 1
Identification and characterization of osgasd knockout mutant plants. (A) Diagram of osgasd knockout mutant (Ko) with the position of the inserted T-DNA (triangle) in the Os04g0512300 gene. Gene-specific (P1 and P2) and T-DNA left border (P3) primers used for PCR genotyping. WT indicates non-transgenic wild-type plants lacking a T-DNA insertion (PCR products amplified by only P1+P2). PCR products amplified with the indicated P1+P3 primer sets and both P1+P2 and P1+P3 were homozygous and heterozygous plants, respectively. M, DNA size marker. (B) RT-qPCR analysis showing transcript levels of OsGASD in the WT plant or osgasd mutants. Error bars indicate SD. OsActin1 (Os03g0718100) was used as an internal control and relative expression levels are shown in fold values. Asterisks indicate statistically significant differences between the corresponding samples and their control (p-value<0.1, Student’s t-test). Lines 1 (ko1) was used in this study. (C) Analysis of GUS staining in panicles neck node and spikelet of WT and osgasd knockout mutant which is carrying the P35S::GUS transgenes. (D, E) Comparison of shoot length in wild-type and osgasd knock mutant (Ko1). (D) Growth of wild-type plants and Ko1 mutants grown on MS media for 10 days (Scare bar = 1 cm).
Figure 2
Figure 2
Analysis of OsGASD expression and effect of osgasd knockout mutant morphology in response to GA. (A) RT-qPCR analysis shows expression patterns of OsGASD in shoot and root. (B) The transcript level of OsGASD is shown in response to GA. Ten-day-old wild-type seedlings (Dongjin) were treated with 100 µM GA3 for 15min. Control plants were not treated with GA (Con). Error bars indicate SD. OsActin1 (Os03g0718100) was used as an internal control and relative expression levels are shown in fold values. Asterisks indicate statistically significant differences between the corresponding samples and their control (p-value<0.1, Student’s t-test). (C-F) Growth of osgasd knockout mutant grown on green house. (C and D) At the panicle heading stage (14 weeks) of osgasd knockout mutant treated with the indicated concentration of GA for 1, 10, 20 mg/L (ppm) (C) GA3 solution were sprayed with distilled water as control. Scale bar=15cm (D) Plant height measured seven days later for analysis. (E, F) P and PL indicated the panicle and panicle length. I to V indicated the corresponding internodes from top to bottom. Scale bar=10cm (E). Quantification of plant height (D), panicle and internodes length, and tiller number (F) in osgasd knockout mutant treated with GA (n>20). WT plants did not treat with GA. Error bars indicate SD. Asterisks indicate statistically significant differences between the corresponding samples and their control (p-value<0.1, Student’s t-test).
Figure 3
Figure 3
Analysis of GA3 concentrations and GA biosynthesis genes expression in osgasd knockout mutant and OsGASD-overexpressing transgenic plants. (A, B) GA3 concentrations were measured in the shoots (A) and roots (B) of Ko, Ox and WT plants grown on MS media for 30 days. (C) RT-qPCR analysis shows changes in transcriptional expression levels in shoot of Ko, Ox and WT plants. CPS, Copalyl diphosphate synthase; KS, ent-kaurene synthase; KO, ent- kaurene oxidase; KAO, ent- kaurenoic acid hydroxylase; GA20, GA 20 oxidase; GA2, GA 2 oxidase. Error bars indicate SD. OsActin1 (Os03g0718100) was used as an internal control and relative expression levels are shown in fold values. Asterisks indicate statistically significant differences between the corresponding samples and their control (p-value<0.1, Student’s t-test).
Figure 4
Figure 4
Expression of OsGASD affects agronomic traits under normal growth conditions. (A) Morphology of 25-week-old wild-type (WT), osgasd knockout mutant (Ko) and OsGASD-overexpressing (Ox) plants grown in the field. Scale bar = 15 cm (B) Images show the main panicles and internodes. P and PL indicated the panicle and panicle length. I to V indicated the corresponding internodes from top to bottom. Scale bar=10cm. (C) Images show the panicles with grains. The panicles shown were grain from a single main panicle. (D) Images show the size of the grains Ox and Ko indicate OsGASD-overexpressing and mutant plants, respectively. WT indicates wild-type plants. Scale bars = 15 cm in (A) 5cm in (B), 1cm in 0.2cm in (D). (E–K) The analysis of agronomic traits of the Ox and Ko plants grown in field. Plant height (E), internode length and panicle (F), panicle number (G), filling rate (H), number of spikelet per panicle (I), total grain weight (J) and thousand grain weight (K). (L) analysis of seed length and width of the Ox and Ko plants. Three independent lines of T4 OsGASD-Ox and -Ko plants were analyzed together with their wild-type counterparts grown in the same conditions. The values represent the percentage of the mean values (n = 30) listed in Tables S1 . Mean values of WT controls were set at 100% as a reference. Asterisks indicate statistically significant differences between the corresponding samples and their control (p-value<0.1, Student’s t-test).
Figure 5
Figure 5
Analysis of flag leaf morphology and plant development related transcript level in osgasd knockout mutant and OsGASD-overexpressing transgenic plants. (A, B) Morphology of flag leaf in wild-type (WT), osgasd knockout mutant (Ko) and OsGASD-overexpressing (Ox) plants grown in the field. Image show flag leaf (A) and flag leaf surface (B). Scale bar = 1cm (A) and 0.5cm (B). (C, D) Length © and width (D) of flag leaf in WT, osgasd Ko and OsGASD-Ox plants. Error bars indicate SD (n = 20). (E, F) Analysis of plant development related genes expression in WT, Ko and Ox plants. The transcripts were selected by transcriptome analysis in flag leaf of osgasd Ko, OsGASD-Ox and WT plants. RT-qPCR analysis shows up-regulated (E) and down-regulated (F) transcriptional expression levels. The gene name and accession liseted in Tables S2 . Error bars indicate SD. OsActin1 (Os03g0718100) was used as an internal control and relative expression levels are shown in fold values. Asterisks indicate statistically significant differences between the corresponding samples and their control (p-value<0.1, Student’s t-test).

References

    1. Acevedo-Siaca L. G., Coe R., Quick. W. P., Long S. P. (2021). Variation between rice accessions in photosynthetic induction in flag leaves and underlying mechanisms. J. Exp. Bot. 72 (4), 1282–1294. doi: 10.1093/jxb/eraa520 - DOI - PMC - PubMed
    1. Bae K. D., Um T. Y., Yang W. T., Park T. H., Hong S. Y., Kim K. M., et al. . (2021). Characterization of dwarf and narrow leaf (dnl-4) mutant in rice. Plant Signaling Behav. 16 (2), 1849490. doi: 10.1080/15592324.2020.1849490 - DOI - PMC - PubMed
    1. Barboza L., Effgen S., Alonso-Blanco C., Kooke R., Keurentjes J. J. B., Koornneef M., et al. . (2013). Arabidopsis semidwarfs evolved from independent mutations in GA20ox1, ortholog to green revolution dwarf alleles in rice and barley. Proc. Natl. Acad. Sci. U. S. A. 110, 15818–15823. doi: 10.1073/pnas.1314979110 - DOI - PMC - PubMed
    1. Cui W., Zhuang Z., Jiang P., Pan J., Zhao G., Xu S., et al. . (2022). Characterization, expression profiling, and biochemical analyses of the cinnamoyl-CoA reductase gene family for lignin synthesis in alfalfa plants. Int. J. Mol. Sci. 23 (14), 7762. doi: 10.3390/ijms23147762 - DOI - PMC - PubMed
    1. Diao M., Huang S. (2021). An update on the role of the actin cytoskeleton in plasmodesmata: A focus on formins. Front. Plant Sci. 12. doi: 10.3389/fpls.2021.647123 - DOI - PMC - PubMed