

Changes in the global, regional, and national burdens of NAFLD from 1990 to 2019: A systematic analysis of the global burden of disease study 2019
- PMID: 36618688
- PMCID: PMC9811393
- DOI: 10.3389/fnut.2022.1047129
Changes in the global, regional, and national burdens of NAFLD from 1990 to 2019: A systematic analysis of the global burden of disease study 2019
Abstract
Background: Understanding the burdens and trends of non-alcoholic fatty liver disease (NAFLD) is necessary for developing effective intervention strategies. In this study, Global Burden of Disease (GBD) 2019 study data were extracted and analyzed to elucidate trends of NAFLD.
Methods: The prevalence, incidence, disability-adjusted life year (DALY), and death rates of NAFLD in geographic populations worldwide from 1990 to 2019 were extracted from the GBD 2019 study data. The global temporal trend of NAFLD from 1990 to 2019 was evaluated using estimated annual percentage changes (EAPCs) and age-standardized rates.
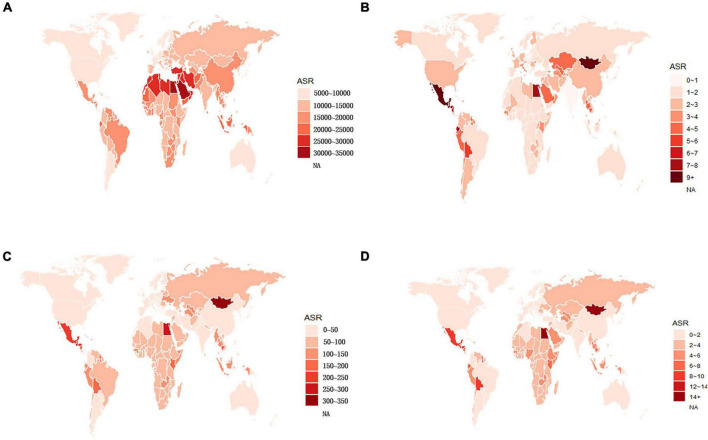
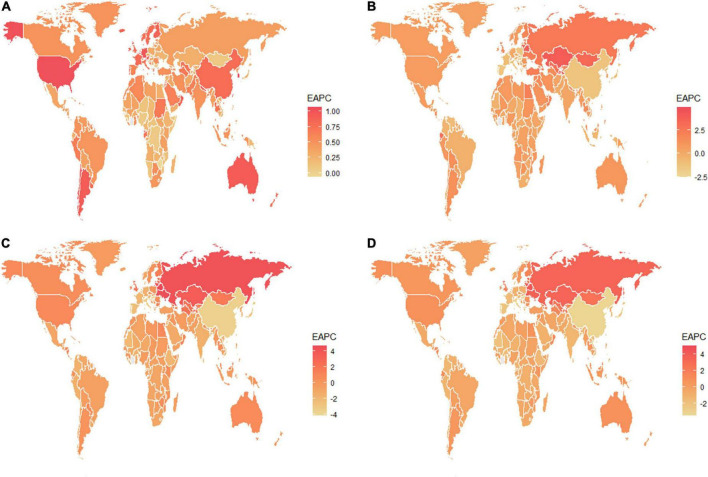
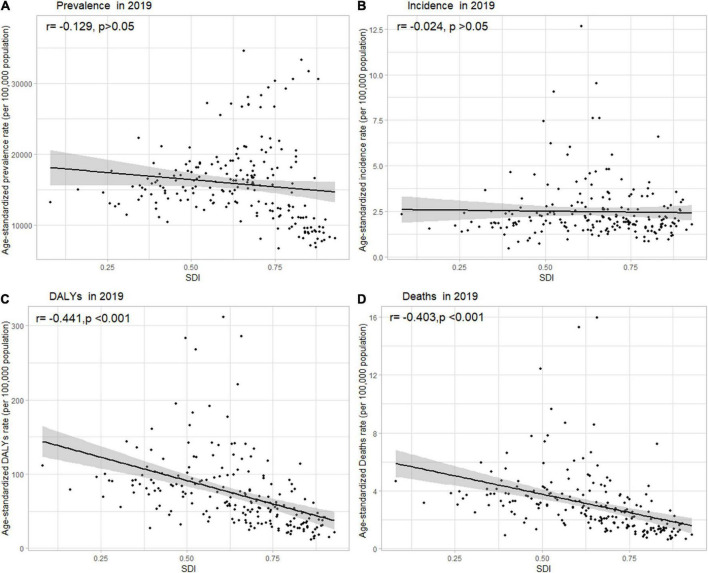
Results: Globally, between 1999 and 2019, the age-standardized prevalence rate of NAFLD increased, with EAPCs of 0.77 [95% CI (0.69, 0.85)], whereas the DALY and Death rates decreased, with EAPCs of -0.82 [95% CI (-0.92, -0.71)], and -0.67 [95% CI (-0.76, -0.58)], respectively. Geographically, the age-standardized prevalence rate showed the most serious upward trend in high-income North America with an EAPC of 0.98 [95% CI (0.95, 1.02)], and the age-standardized incidence rate showed an upward trend in Central Asia with an EAPC of 3.17 [95% CI (2.2, 2.49)]. The most significant upward trend of DALY and death rates appeared in Eastern Europe, with EAPCs of 4.06 [95% CI (3.31, 4.82)], and 3.36 [95% CI (2.77, 3.96)], respectively. At the country level, the age-standardized rates showed an upward trend in Armenia, Belarus, and Republic of Korea. Regarding age groups, the percentage change of prevalence was the highest in the 40 to 44 group [0.29 (0.26, 0.34)] from 1990 to 2019; the percentage change of incidence was the highest in the 85 to 89 group [0.46 (0.12, 0.71)] from 1990 to 2019; the percentage change of DALY was the highest in the 80 to 84 group [0.25 (0.11, 0.39)] from 1990 to 2019; and the percentage change of death rate was the highest in the 15 to 19 group [0.36 (0.17, 0.60)] from 1990 to 2019. The percentage change of prevalence of liver cancer due to NASH was the highest in the group of 85 to 89, whereas those of incidence, DALY, and death were the highest in the group above 95 from 1990 to 2019. Regarding the sociodemographic index (SDI), the highest age-standardized prevalence, incidence, and Death rates of NAFLD occurred in middle-SDI countries, and the highest DALY rates of NAFLD occurred in low-SDI countries.
Conclusion: Global NAFLD burdens have increased since 1990. Our findings provide a reference for policymakers to reduce the burden of NAFLD, especially in middle and low-SDI countries.
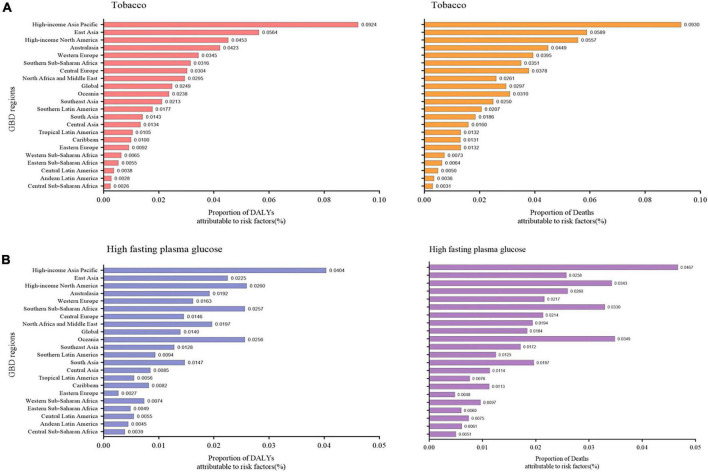
Keywords: GBD study; economic burden; non-alcoholic fatty liver disease; risk factors; sociodemographic index.
Copyright © 2022 Wang, Xu, Zhu, Li, Li, Li, Shen, Wu, Liu and Han.
Conflict of interest statement
The authors declare that the research was conducted in the absence of any commercial or financial relationships that could be construed as a potential conflict of interest.
Figures
Similar articles
-
Analysis of global prevalence, DALY and trends of inflammatory bowel disease and their correlations with sociodemographic index: Data from 1990 to 2019.Autoimmun Rev. 2024 Nov;23(11):103655. doi: 10.1016/j.autrev.2024.103655. Epub 2024 Oct 2. Autoimmun Rev. 2024. PMID: 39366514 Review.
-
Assessing and projecting the global impacts of Alzheimer's disease.Front Public Health. 2025 Jan 15;12:1453489. doi: 10.3389/fpubh.2024.1453489. eCollection 2024. Front Public Health. 2025. PMID: 39882109 Free PMC article.
-
Global Burden and Trends of Primary Liver Cancer Attributable to Comorbid Type 2 Diabetes Mellitus Among People Living with Hepatitis B: An Observational Trend Study from 1990 to 2019.J Epidemiol Glob Health. 2024 Jun;14(2):398-410. doi: 10.1007/s44197-024-00237-1. Epub 2024 May 7. J Epidemiol Glob Health. 2024. PMID: 38713342 Free PMC article.
-
Global, regional, and national burdens of common micronutrient deficiencies from 1990 to 2019: A secondary trend analysis based on the Global Burden of Disease 2019 study.EClinicalMedicine. 2022 Feb 12;44:101299. doi: 10.1016/j.eclinm.2022.101299. eCollection 2022 Feb. EClinicalMedicine. 2022. PMID: 35198923 Free PMC article.
-
Global, regional, and national burdens of leukemia from 1990 to 2017: a systematic analysis of the global burden of disease 2017 study.Aging (Albany NY). 2021 Apr 4;13(7):10468-10489. doi: 10.18632/aging.202809. Epub 2021 Apr 4. Aging (Albany NY). 2021. PMID: 33820874 Free PMC article.
Cited by
-
Nonalcoholic Fatty Liver Disease vs Metabolic-associated Fatty Liver Disease vs Metabolic Dysfunction-associated Steatotic Liver Disease: What's in the Name?Euroasian J Hepatogastroenterol. 2024 Jan-Jun;14(1):1-4. doi: 10.5005/jp-journals-10018-1424. Euroasian J Hepatogastroenterol. 2024. PMID: 39022204 Free PMC article.
-
Long-term exposure to ambient air pollution and the incidence of nonalcoholic fatty liver disease: a cohort study.Int J Epidemiol. 2025 Jun 11;54(4):dyaf101. doi: 10.1093/ije/dyaf101. Int J Epidemiol. 2025. PMID: 40574482 Free PMC article.
-
Identification of Cuproptosis-Related Genes in Nonalcoholic Fatty Liver Disease.Oxid Med Cell Longev. 2023 Feb 21;2023:9245667. doi: 10.1155/2023/9245667. eCollection 2023. Oxid Med Cell Longev. 2023. PMID: 36865349 Free PMC article.
-
Burden of NASH related liver cancer from 1990 to 2021 at the global, regional, and national levels.Front Nutr. 2025 Jan 27;12:1510563. doi: 10.3389/fnut.2025.1510563. eCollection 2025. Front Nutr. 2025. PMID: 39931368 Free PMC article.
-
Convergence of Alcohol Consumption and Dietary Quality in US Adults Who Currently Drink Alcohol: An Analysis of Two Core Risk Factors of Liver Disease.Nutrients. 2024 Nov 13;16(22):3866. doi: 10.3390/nu16223866. Nutrients. 2024. PMID: 39599652 Free PMC article.
References
LinkOut - more resources
Full Text Sources