. 2023 Feb 17;26(2):105928.
doi: 10.1016/j.isci.2023.105928. Epub 2023 Jan 4.

Continuous population-level monitoring of SARS-CoV-2 seroprevalence in a large European metropolitan region

Marc Emmenegger  1 Elena De Cecco  1 David Lamparter  2 Raphaël P B Jacquat  3   4 Julien Riou  5 Dominik Menges  6 Tala Ballouz  6 Daniel Ebner  7 Matthias M Schneider  3 Itzel Condado Morales  1 Berre Doğançay  1 Jingjing Guo  1 Anne Wiedmer  1 Julie Domange  1 Marigona Imeri  1 Rita Moos  1 Chryssa Zografou  1 Leyla Batkitar  1 Lidia Madrigal  1 Dezirae Schneider  1 Chiara Trevisan  1 Andres Gonzalez-Guerra  1 Alessandra Carrella  1 Irina L Dubach  8 Catherine K Xu  3 Georg Meisl  3 Vasilis Kosmoliaptsis  9   10 Tomas Malinauskas  11 Nicola Burgess-Brown  12 Ray Owens  11   13 Stephanie Hatch  7 Juthathip Mongkolsapaya  14 Gavin R Screaton  14 Katharina Schubert  15 John D Huck  16 Feimei Liu  16 Florence Pojer  17 Kelvin Lau  17 David Hacker  17 Elsbeth Probst-Müller  18 Carlo Cervia  18 Jakob Nilsson  18 Onur Boyman  18   19 Lanja Saleh  20 Katharina Spanaus  20 Arnold von Eckardstein  20 Dominik J Schaer  8 Nenad Ban  15 Ching-Ju Tsai  21 Jacopo Marino  21 Gebhard F X Schertler  21   22 Nadine Ebert  23   24 Volker Thiel  23   24 Jochen Gottschalk  25 Beat M Frey  25 Regina R Reimann  1 Simone Hornemann  1 Aaron M Ring  16 Tuomas P J Knowles  3   4 Milo A Puhan  6 Christian L Althaus  5 Ioannis Xenarios  2   26 David I Stuart  11 Adriano Aguzzi  1
Affiliations

Continuous population-level monitoring of SARS-CoV-2 seroprevalence in a large European metropolitan region

Marc Emmenegger et al. iScience. .

Abstract

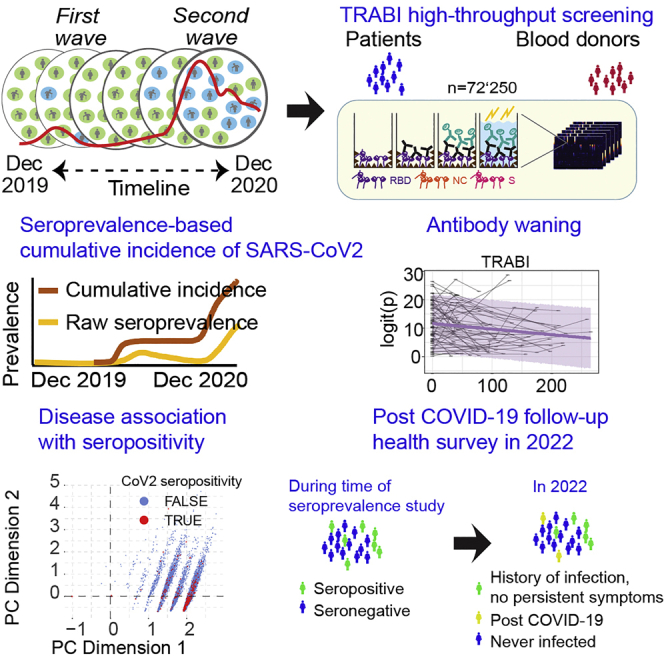
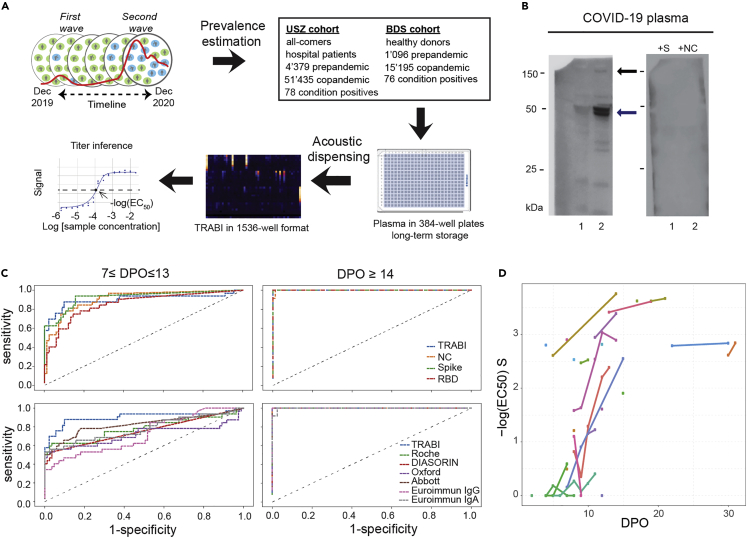
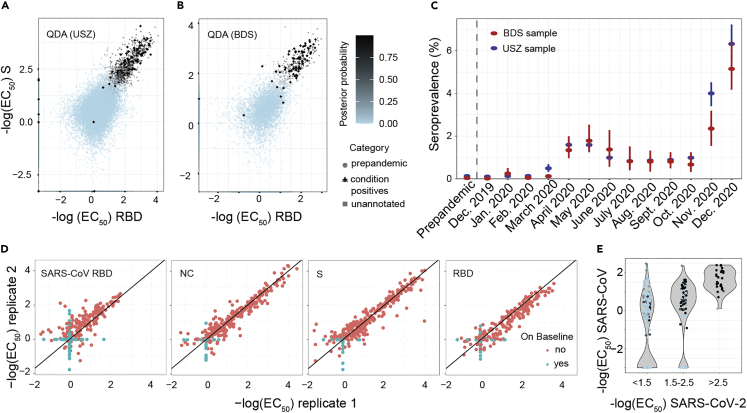
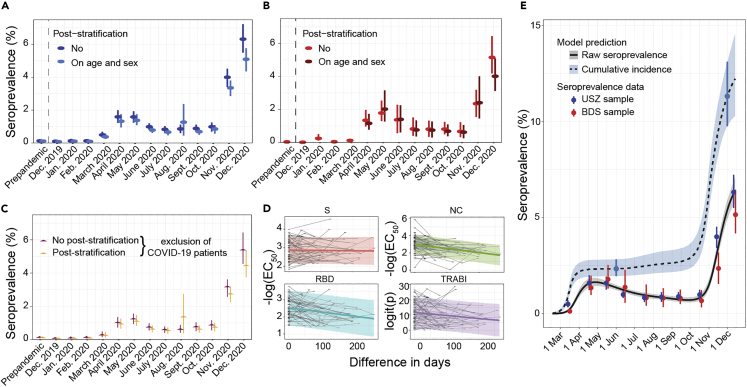
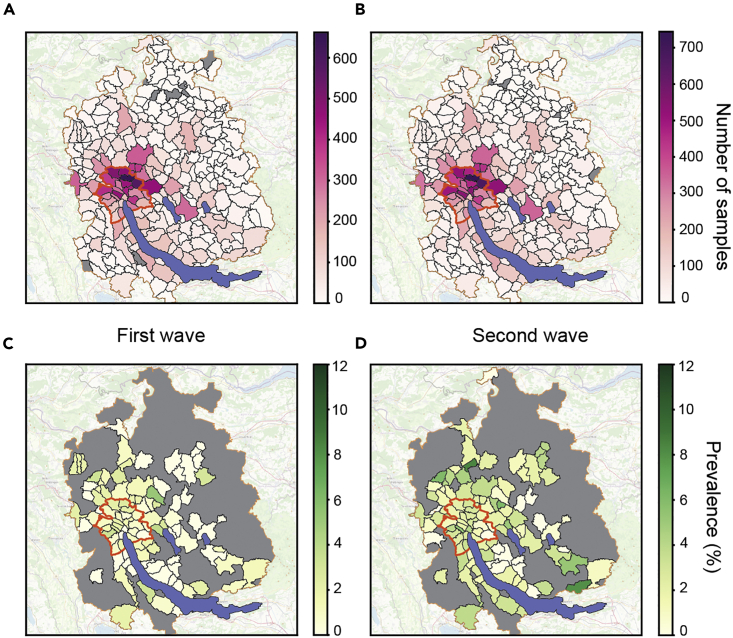
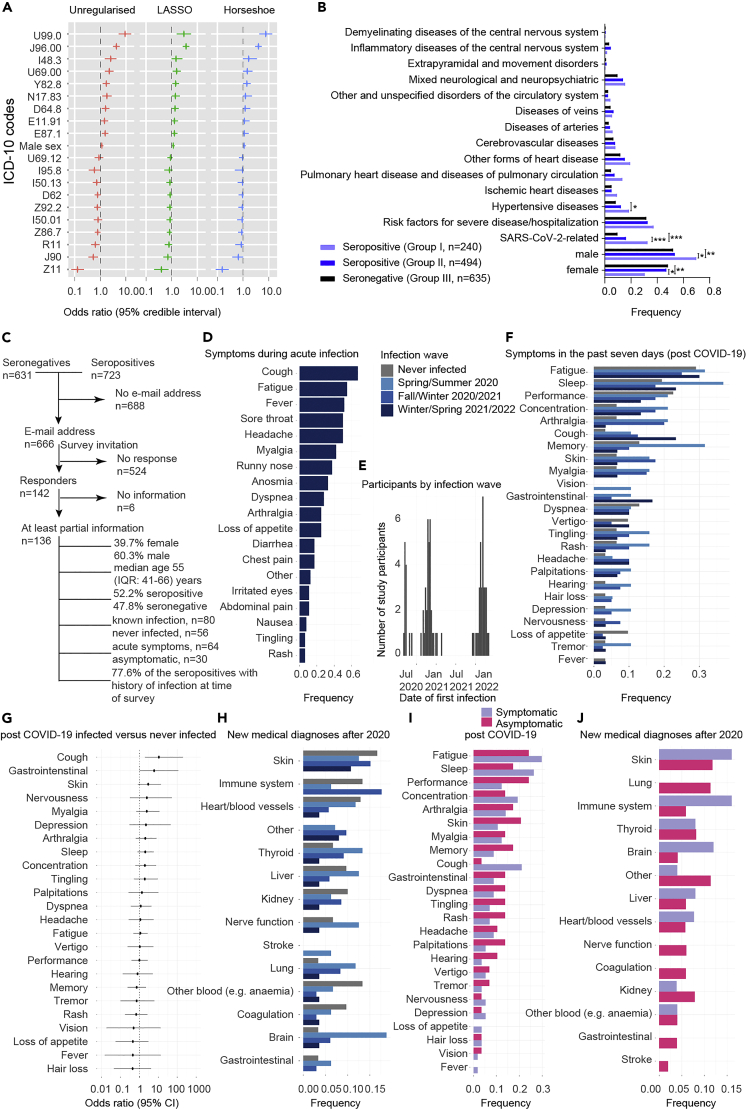
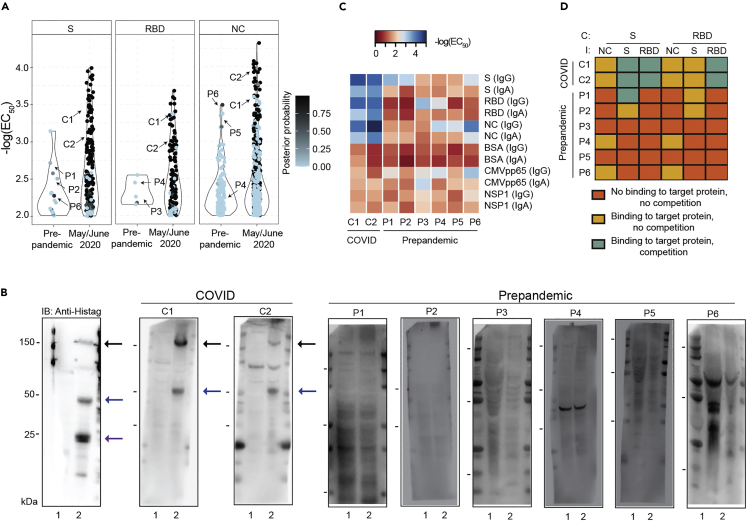
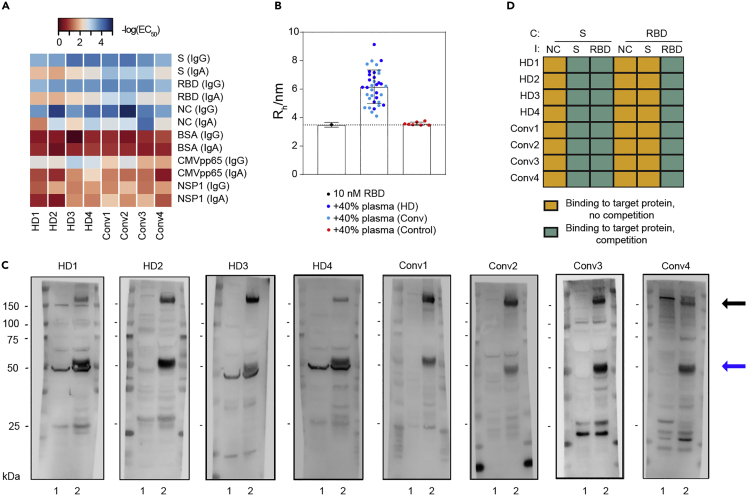
Effective public health measures against SARS-CoV-2 require granular knowledge of population-level immune responses. We developed a Tripartite Automated Blood Immunoassay (TRABI) to assess the IgG response against three SARS-CoV-2 proteins. We used TRABI for continuous seromonitoring of hospital patients and blood donors (n = 72'250) in the canton of Zurich from December 2019 to December 2020 (pre-vaccine period). We found that antibodies waned with a half-life of 75 days, whereas the cumulative incidence rose from 2.3% in June 2020 to 12.2% in mid-December 2020. A follow-up health survey indicated that about 10% of patients infected with wildtype SARS-CoV-2 sustained some symptoms at least twelve months post COVID-19. Crucially, we found no evidence of a difference in long-term complications between those whose infection was symptomatic and those with asymptomatic acute infection. The cohort of asymptomatic SARS-CoV-2-infected subjects represents a resource for the study of chronic and possibly unexpected sequelae.

Keywords: Biological database; Immunology; Microbiology; Virology.


Conflict of interest statement

TPJK is a member of the board of directors of Fluidic Analytics. AA is a member of the board of directors of Mabylon AG which has funded antibody-related work in the Aguzzi lab in the past. All other authors declare no competing interests.

Figures

None
Graphical abstract
Figure 1
Figure 1
Study overview and establishment of serological pipeline (A) To estimate the prevalence of CoV2 seropositivity in the population, prepandemic, and copandemic samples from two independent cohorts were analyzed by high-throughput microELISA (TRABI). IgG titers against S, RBD, and NC were determined and the -log(EC50) was inferred by regression analysis. (B) Vero cells infected with CoV2 (lane 2), but not uninfected cells (lane 1), showed signals corresponding to S (black arrow) and NC (blue arrow, pointing at two bands) when immunoblotted with COVID-19 patient plasma. NC protein undergoes a proteolytic cleavage in SARS-CoV-infected VeroE6 cells, resulting in two distinct bands of around 46 and 43 kDa. We confirmed the identity of the two bands by probing with an anti-NC antibody (Sino Biologicals, data not shown). Spiking of COVID-19 patient plasma with recombinant S and NC led to the disappearance of all signals. (C) Upper panel: Using 53 samples from confirmed patients with CoV2 and 83 prepandemic samples, we assessed the specificity-sensitivity relationship for all antigens individually and after combining all results into a single score (TRABI) using QDA-based posterior probability. Between 7 and 13 dpo, approximately 60% of samples were positive (posterior probability >0.5) at 100% specificity cutoff, whereas 100% sensitivity was reached at 14 dpo. Lower panel: COVID and prepandemic samples were used to assess the performance of TRABI, commercial tests (Roche, DiaSorin, Abbott, Euroimmun), and an assay developed at the Target Discovery Institute (Oxford). While all tests scored equally at ≥14 dpo, TRABI outperformed all other assays at ≤13 dpo. (D) Time course of IgG response in 55 samples from 27 patients with COVID-19. IgG antibodies were reliably detectable at ≥13 dpo. Colors represent individual patients.
Figure 2
Figure 2
Evolution of CoV2 prevalence in a cohort of Zurich University Hospital (USZ) patients and donors from the blood donation service (BDS) (A and B) Inflection points of dilution curves, denoted -log(EC50), of plasma titrated against S and RBD in the USZ and BDS cohorts. Posterior probabilities were calculated using QDA assuming a multivariate Gaussian distribution. (C) Prevalence of CoV2 seropositivity in prepandemic (before December 2019) and copandemic samples (from December 2019 to December 2020) estimated using the posterior probabilities from the multivariate Gaussian distribution (QDA). Bar: 95% confidence intervals (CI). (D) TRABI reproducibility was assessed using duplicates run in pairs of independent assay plates. (E) To assess the potential cross-reactivity of CoV2 seropositive individuals, we tested 200 high-scoring samples and 112 random samples for binding to the RBD of SARS-CoV. CoV2 RBD binders with a high posterior probability (same color maps as in B) segregated within the higher anti-SARS-CoV-RBD titers.
Figure 3
Figure 3
Post-stratification and antibody waning (A) Seroprevalence in USZ patient cohort after post-stratification on age and sex using the age and sex distributions of the canton of Zurich. Bar: 95% confidence intervals. (B) Seroprevalence in BDS cohort after post-stratification on age and sex using the age and sex distributions of the canton of Zurich. Bar: 95% confidence intervals. (C) Seroprevalence in the USZ patient cohort after removal of patients hospitalized because of COVID-19, for both raw seroprevalence and seroprevalence data after post-stratification on age and sex. Bar: 95% confidence intervals. (D) Antibody waning observed with longitudinal sampling. (E) Dynamics of SARS-CoV-2 seroprevalence data in USZ and BDS samples between February and December 2020. The seroprevalence is shown in gray (median and 95% CrI). The corresponding model-predicted cumulative incidence, or infection attack rate (IAR), is shown in light blue, with highlighted values on June 1 and December 1.
Figure 4
Figure 4
Seroprevalence maps for municipalities in the canton of Zurich (A) Samples of hospital patients residing in Zurich sorted according to zip codes. Data from January 2020 to June 2020, including the first wave. (B) Samples of hospital patients residing in Zurich sorted according to zip codes. Data from July 2020 to December 2020, including the second wave. (C) Seropositive samples of hospital patients residing in Zurich sorted according to zip codes. Data from January 2020 to June 2020, including the first wave. (D) Seropositive samples of hospital patients residing in Zurich sorted according to zip codes. Data from July 2020 to December 2020, including the second wave. C and D: Only municipalities with at least 50 samples/zip code are displayed. The border of the area of the city of Zurich is surrounded by a dense red line while the municipalities contained within the canton of Zurich, at the border to another canton, are displayed with a lighter orange line.
Figure 5
Figure 5
Exploratory analysis of CoV2 seropositivity with ICD-10 codes and free-text medical reports (A) Multiple logistic regression after logit-transforming the posterior probability in a Bayesian framework. Shown is the odds ratio with a 95% credible interval. (B) Group-wise frequencies (number of counts divided by total per group) of different disease classes/conditions. Fisher exact test was performed to test for deviations from expected frequencies. Male patients were much more prevalent among the seropositive patients with COVID-19 (69.6% male versus 30.4% female) than in the two other groups, at statistical significance (adjusted p values <0.002). Hypertensive diseases were more prevalent in patients with COVID-19 compared with seronegative patients (adjusted p value = 0.002). p values were adjusted for the number of comparisons conducted (i.e. 45) using post-hoc p value adjustment. (C) Flowchart for the inclusion of serologically tested individuals participating in the follow-up online health survey in April/May 2022. A total of 136 individuals provided informed consent and filled the electronic questionnaire, among which 80 reported a known CoV2 infection up to questionnaire completion. (D) Frequency of symptoms reported by online health survey participants reporting a symptomatic infection prior to April/May 2022 (n = 64). (E) Date of first infection reported by online health survey participants with a known infection prior to April/May 2022 (n = 80, 2 participants with missing date). Three pandemic waves were reflected in the data: Spring/Summer 2020 (first wildtype CoV2 wave), Fall/Winter 2020/2021 (second wildtype CoV2 wave), and Winter/Spring 2021/2022 (omicron CoV2 wave). (F) Proportion of online health survey participants reporting to have experienced within the last seven days prior to questionnaire completion, stratified by prior infection status and pandemic wave during which the infection occurred. (G) Odds ratio of experiencing specific symptoms within the last seven days prior to questionnaire completion in the group of online health survey participants with reported known prior infection compared to the group of participants without known infection, based on multivariable logistic regression models adjusted for age and sex (central estimate: odds ratio, error bars: 95% confidence interval (95%CI)). (H) Proportion of online health survey participants reporting having received a new medical diagnosis after 2020, stratified by prior infection status and pandemic wave during which the infection occurred. (I) Proportion of online health survey participants reporting to have experienced within the last seven days prior to questionnaire completion, stratified by symptoms during acute infection. (J) Proportion of participants reporting having received a new medical diagnosis after 2020, stratified by symptoms during acute infection. Adjusted p values ≤0.01: ∗. Adjusted p values ≤0.001: ∗∗. Adjusted p values ≤0.0001: ∗∗∗.
Figure 6
Figure 6
Characterization of prepandemic samples (A) Posterior probability was calculated assuming a Gaussian distribution and visualized for individual antigens (S, RBD and NC) for prepandemic samples vs. copandemic USZ samples drawn in May and June 2020. Prepandemic samples exhibited a low posterior probability as they typically reacted against single antigens, leading to low rankings in a composite metric. For further testing, comparative samples were chosen from the prepandemic era and from May and June 2020. Arrows point to samples of individuals used in (B), (C), (D). P1-6: prepandemic 1-6; C1-2: COVID1-2. (B) Western Blot analysis of two samples from May/June 2020 (“COVID 1” or C1 and “COVID 2” or C2) and several prepandemic samples (P1-6). Anti-his-tag antibody was included as a positive control. Lane 1 = non-transfected Expi293F cell lysate; Lane 2 = Expi293F cell lysates expressing his-tagged S, NC, and RBD proteins. Black arrows: S; blue arrows: NC; purple arrow: RBD. The molecular weights (in kDa) are depicted on the left side and refer to the bands shown in all blots. (C) ELISA assays on the same samples as in B, using CoV2 S, NC, RBD, and NSP1 as well as control proteins (BSA, CMV pp65), shown in the form of a heatmap where the -log(EC50) of the sample dilution is depicted. (D) Competition assays were carried out in the same samples as in B and C. Competition (C) was performed with S (0.04-88 nM) or RBD (0.7-1,350 nM) and plates were immobilized (I) with S, RBD, or NC. Data from duplicates is depicted using the following qualitative categories: No binding to target protein, no competition (orange). Binding to target protein, no competition (yellow). Binding to target protein, competition (turquoise). Soluble antigens suppressed the ELISA signal in the COVID samples but not in the prepandemic sample (except for P1 where soluble S competed with the immobilized S), showing that the antibodies present in the latter had lower affinities for CoV2 targets.
Figure 7
Figure 7
Assay validation in solution and clonality of anti-S immune response (A) ELISA assays of healthy blood donors vs. convalescent individuals depicted as heatmap. The -log(EC50) depicts the sample dilution at which half-maximum binding occurs. S, RBD, and NC are strongly bound by both healthy donors (HDs) as well as convalescent (Conv) individuals. (B) Microfluidic-based assessment of binding between an Alexa 647-labelled RBD antigen and antibodies in solution. No change in diffusion coefficient or the associated hydrodynamic radius was observed in control samples, while all ELISA-positive samples from convalescent and healthy donors indicated a clear binding of antibodies to RBD, confirming the ELISA-based results. Shown are mean +SE. (C) Western Blot analysis of the same individuals tested in (A). Lane 1 = non-transfected Expi293F cell lysate; Lane 2 = Expi293F cell lysates expressing his-tagged S, NC, and RBD proteins. Black arrows: S. Blue arrows: NC. The molecular weights (in kDa) are depicted on the left side and refer to the bands shown in all blots. (D) Competitive ELISA using RBD or S for soluble competition with antibodies in plasma from the same individuals as in (A) and (C). Data is depicted using the following qualitative categories: Binding to target protein, no competition (yellow). Binding to target protein, competition (turquoise). Competition (C) with S or RBD did not change the signal upon immobilization (I) with NC, while competition with S resulted in a decrease in signal upon immobilization with S as well as with RBD. Conversely, competition with RBD only competed signal when immobilized with RBD, not with S, indicating the presence of antibodies against S domains other than RBD.

References

    1. Lamparter, D., Jacquat, R.P.B., Riou, J., Menges, D., Ballouz, T., and Emmenegger, M. (2022). Code repository for SARS-CoV-2 seroprevalence study. 10.5281/ZENODO.7454292.
    1. Zhou P., Yang X.L., Wang X.G., Hu B., Zhang L., Zhang W., Si H.R., Zhu Y., Li B., Huang C.L., et al. A pneumonia outbreak associated with a new coronavirus of probable bat origin. Nature. 2020;579:270–273. doi: 10.1038/s41586-020-2012-7. - DOI - PMC - PubMed
    1. Zhu N., Zhang D., Wang W., Li X., Yang B., Song J., Zhao X., Huang B., Shi W., Lu R., et al. A novel coronavirus from patients with pneumonia in China, 2019. N. Engl. J. Med. 2020;382:727–733. doi: 10.1056/nejmoa2001017. - DOI - PMC - PubMed
    1. Statistisches Amt Kanton Zuerich Open ZH github. 2020. https://github.com/openZH/covid_19
    1. Kucirka L.M., Lauer S.A., Laeyendecker O., Boon D., Lessler J. Variation in false-negative rate of reverse transcriptase polymerase chain reaction-based SARS-CoV-2 tests by time since exposure. Ann. Intern. Med. 2020;173:262–267. doi: 10.7326/M20-1495. - DOI - PMC - PubMed