. 2022 Dec 22:10:1032360.
doi: 10.3389/fcell.2022.1032360. eCollection 2022.

High-throughput in situ perturbation of metabolite levels in the tumor micro-environment reveals favorable metabolic condition for increased fitness of infiltrated T-cells

Affiliations

High-throughput in situ perturbation of metabolite levels in the tumor micro-environment reveals favorable metabolic condition for increased fitness of infiltrated T-cells

Veronica Valvo et al. Front Cell Dev Biol. .

Abstract

Tumor-infiltrating immune cells experience significant metabolic reprogramming in the tumor microenvironment (TME), and they share similar metabolic pathways and nutrient needs with malignant cells. This positions these cell types in direct nutrient competition in the TME. We currently lack a complete understanding of the similarities, differences, and functional consequences of the metabolic pathways utilized by activated immune cells from different lineages versus neoplastic cells. This study applies a novel in situ approach using implantable microdevices to expose the tumor to 27 controlled and localized metabolic perturbations in order to perform a systematic investigation into the metabolic regulation of the cellular fitness and persistence between immune and tumor cells directly within the native TME. Our findings identify the most potent metabolites, notably glutamine and arginine, that induce a favorable metabolic immune response in a mammary carcinoma model, and reveal novel insights on less characterized pathways, such as cysteine and glutathione. We then examine clinical samples from cancer patients to confirm the elevation of these pathways in tumor regions that are enriched in activated T cells. Overall, this work provides the first instance of a highly multiplexed in situ competition assay between malignant and immune cells within tumors using a range of localized microdose metabolic perturbations. The approach and findings may be used to potentiate the effects of T cell stimulating immunotherapies on a tumor-specific or personalized basis through targeted enrichment or depletion of specific metabolites.

Keywords: T-cells infiltration; cancer metabolism; immunometabolism; immunotherapy; in situ perturbation; tumor micro-environment.


Conflict of interest statement

OJ is a consultant to Kibur Medical, Inc. His interest was reviewed and is managed by BWH and MGB Healthcare in accordance with their outside interest policies. The remaining authors declare that the research was conducted in the absence of any commercial or financial relationships that could be construed as a potential conflict of interest.

Figures
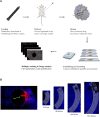
FIGURE 1
FIGURE 1
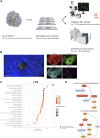
(A) Schematic representation of the experimental pipeline showing the different steps from IMD preparation to image analysis. (B) Image analysis workflow: drug release reservoirs are identified and ROIs are divided in 4 parts with 300 µm depth each.
FIGURE 2
FIGURE 2
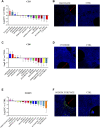
(A,C,E) Quantification of CD3+, CD8+ and FOXP3+ abundance in the corresponding region of each metabolic perturbation. Values are the Log2 of the fold change normalizing the number of positive cells detected in the ROI vs. positive cells in the control region of the same tumor. p-values indicate comparison between signal intensities at each drug site compared to Control (*p < 0.05, **p < 0.005) (B,D,F) Representative images showing the IF/IHC staining on the tumor sections.
FIGURE 3
FIGURE 3
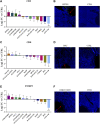
(A,C,E) Quantification of CD3+, CD8+ and FOXP3+ abundance in the corresponding region of each drug perturbation. Values are the Log2 of the fold change normalizing the number of positive cells detected in the ROI vs. positive cells in the control region of the same tumor. p-values indicate comparison between signal intensities at each drug site compared to Control (*p < 0.05, **p < 0.001 ***p < 0.0001) (B,D,F) Representative images showing the IF/IHC staining on the tumor sections.
FIGURE 4
FIGURE 4
(A) Schematic representation for the unbiased metabolomics experiment. (B) Representative images showing the ROIs selection and metabolite quantification. (C) Top 25 most significant pathways enriched comparing CD8 high vs. CD8 low ROIs. (D) Statistical significance of single metabolites in the Cysteine and Methionine Metabolism and Glutathione Metabolism pathways (significant values have p < 0.05).
FIGURE 5
FIGURE 5
(A,B) Volcano plots and single metabolite enrichment representation for both CD8 and FOXP3 enriched ROIs (significant values have p < 0.05).
FIGURE 6
FIGURE 6
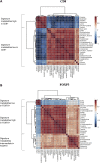
(A,B) Correlation matrixes for the most and less enriched metabolites in both CD8+ and FOXP3+ ROIs. Metabolites have been categorized in low, high and intermediate according to their abundance.
FIGURE 7
FIGURE 7
(A,B) Volcano plots for pathway enrichment in the Reactome Pathway Database comparing CD8 high with either CD8 intermediate or CD8 low ROIs. (C) Significant metabolic pathways follow similar pattern according to their CD8 infiltration, CD8 high ROIs being the most similar to the non-tumoral tissue.

References

    1. Ahn S. W., Ferland B., Jonas O. H. (2021). An interactive pipeline for quantitative histopathological analysis of spatially defined drug effects in tumors. J. Pathol. Inf. 12, 34. 10.4103/jpi.jpi_17_21 - DOI - PMC - PubMed
    1. Alaluf E., Vokaer B., Detavernier A., Azouz A., Splittgerber M., Carrette A., et al. (2020). Heme oxygenase-1 orchestrates the immunosuppressive program of tumor-associated macrophages. JCI Insight 5, 133929. 10.1172/jci.insight.133929 - DOI - PMC - PubMed
    1. Altman B. J., Stine Z. E., Dang C. V. (2016). From krebs to clinic: Glutamine metabolism to cancer therapy. Nat. Rev. Cancer 16, 619–634. 10.1038/nrc.2016.71 - DOI - PMC - PubMed
    1. Andrejeva G., Rathmell J. C. (2017). Similarities and distinctions of cancer and immune metabolism in inflammation and tumors. Cell Metab. 26, 49–70. 10.1016/j.cmet.2017.06.004 - DOI - PMC - PubMed
    1. Angelini G., Gardella S., Ardy M., Ciriolo M. R., Filomeni G., Di Trapani G., et al. (2002). Antigen-presenting dendritic cells provide the reducing extracellular microenvironment required for T lymphocyte activation. Proc. Natl. Acad. Sci. U. S. A. 99, 1491–1496. 10.1073/pnas.022630299 - DOI - PMC - PubMed

LinkOut - more resources