. 2022 Dec 12;26(1):105799.
doi: 10.1016/j.isci.2022.105799. eCollection 2023 Jan 20.

Identifying biomarkers of differential chemotherapy response in TNBC patient-derived xenografts with a CTD/WGCNA approach

Affiliations

Identifying biomarkers of differential chemotherapy response in TNBC patient-derived xenografts with a CTD/WGCNA approach

Varduhi Petrosyan et al. iScience. .

Abstract

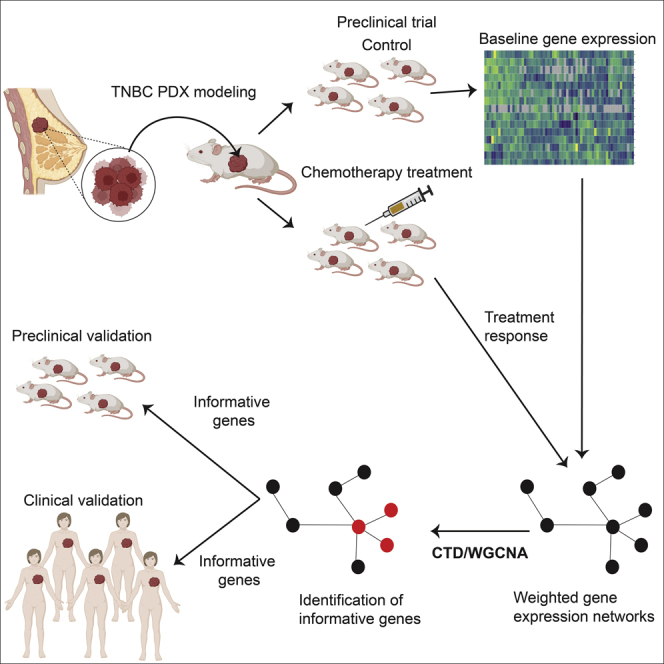
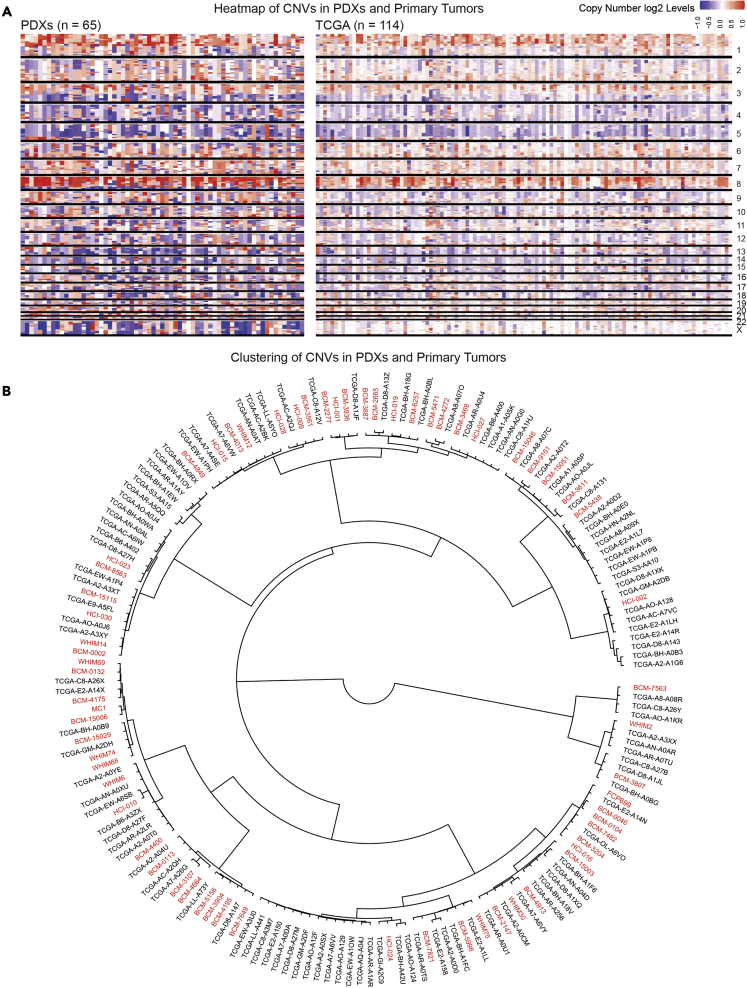
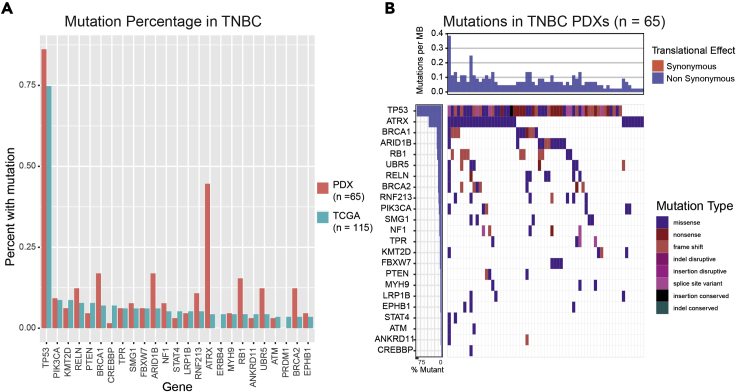
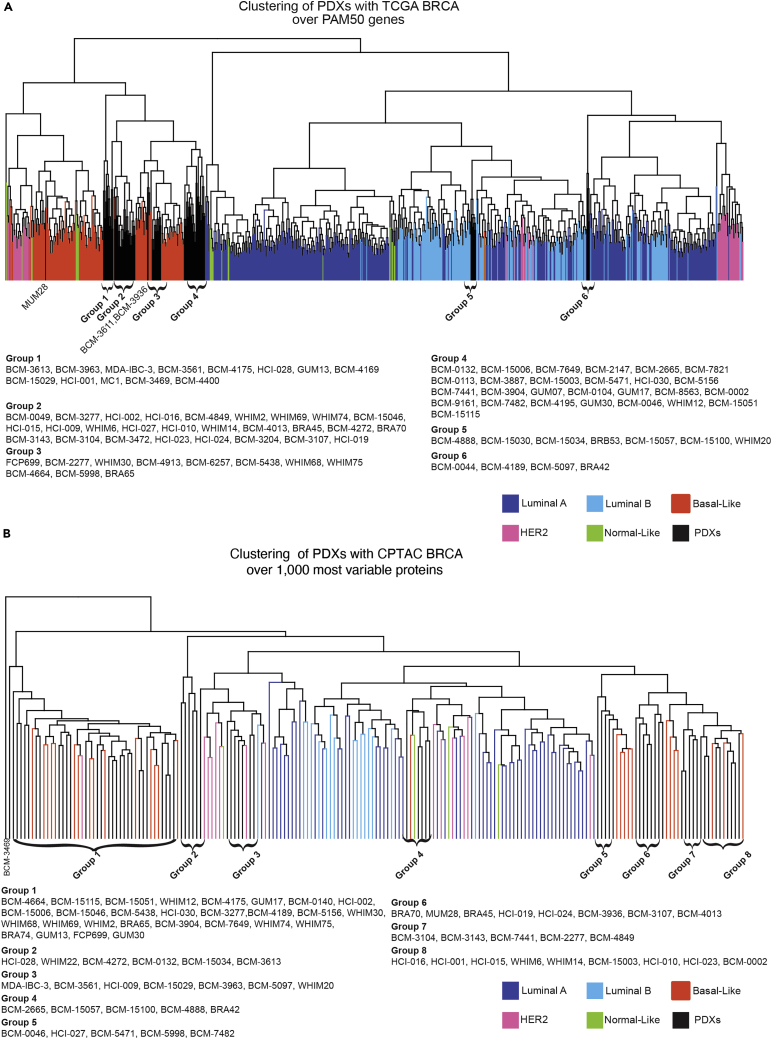
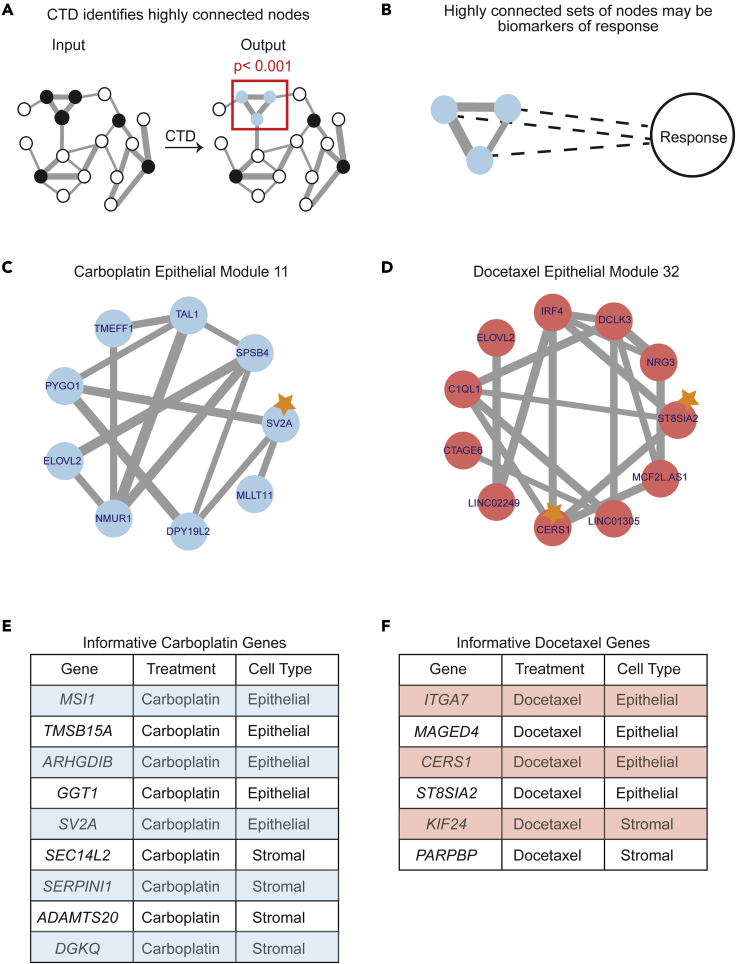
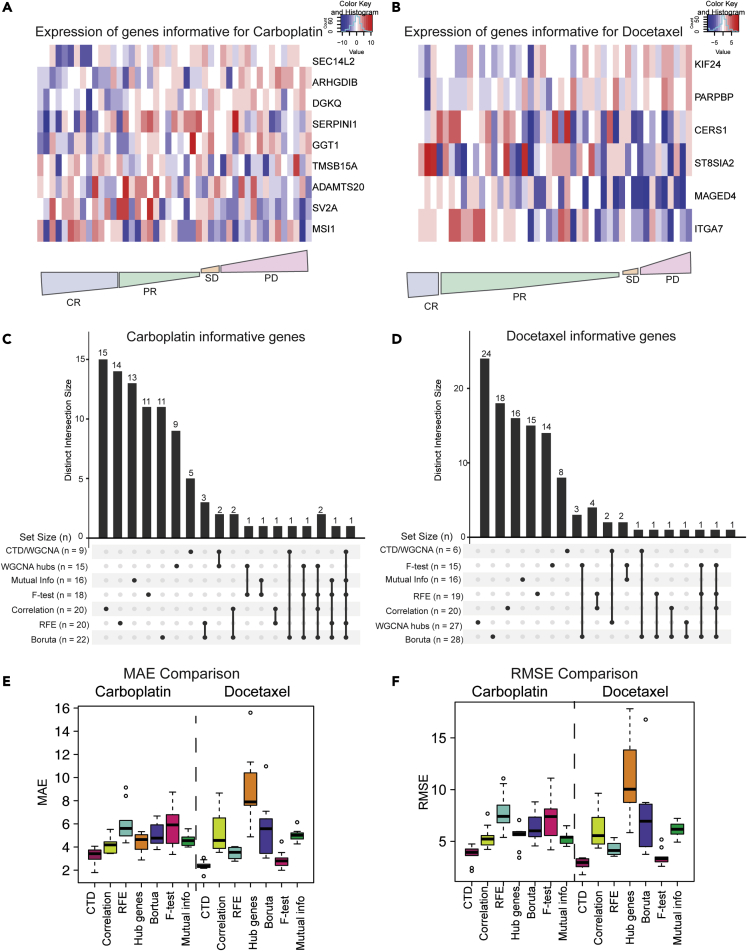
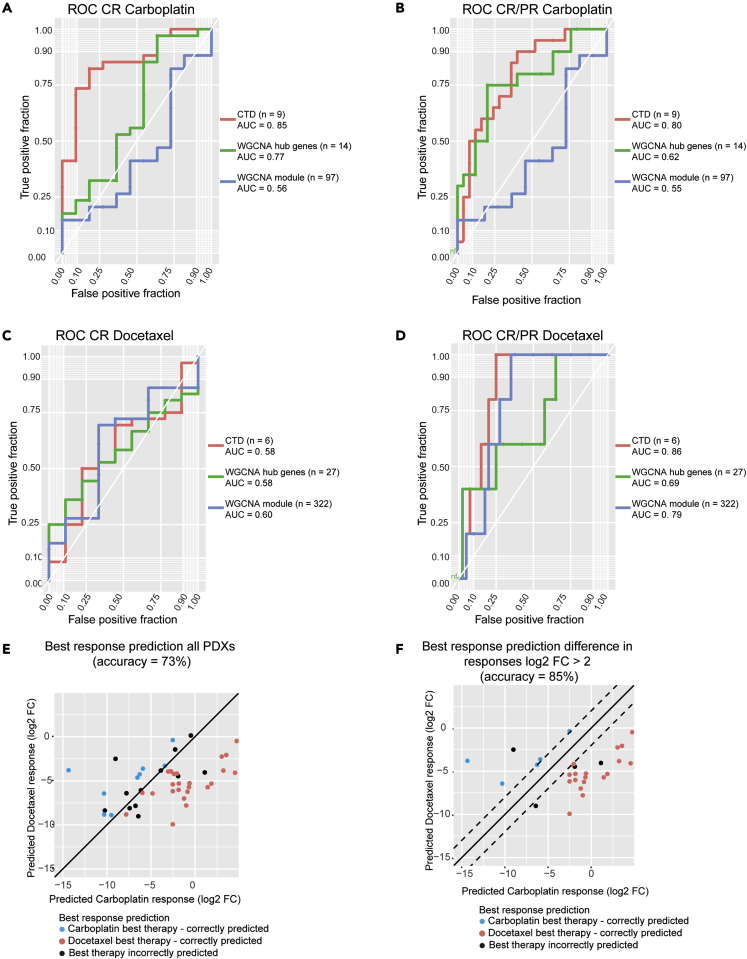
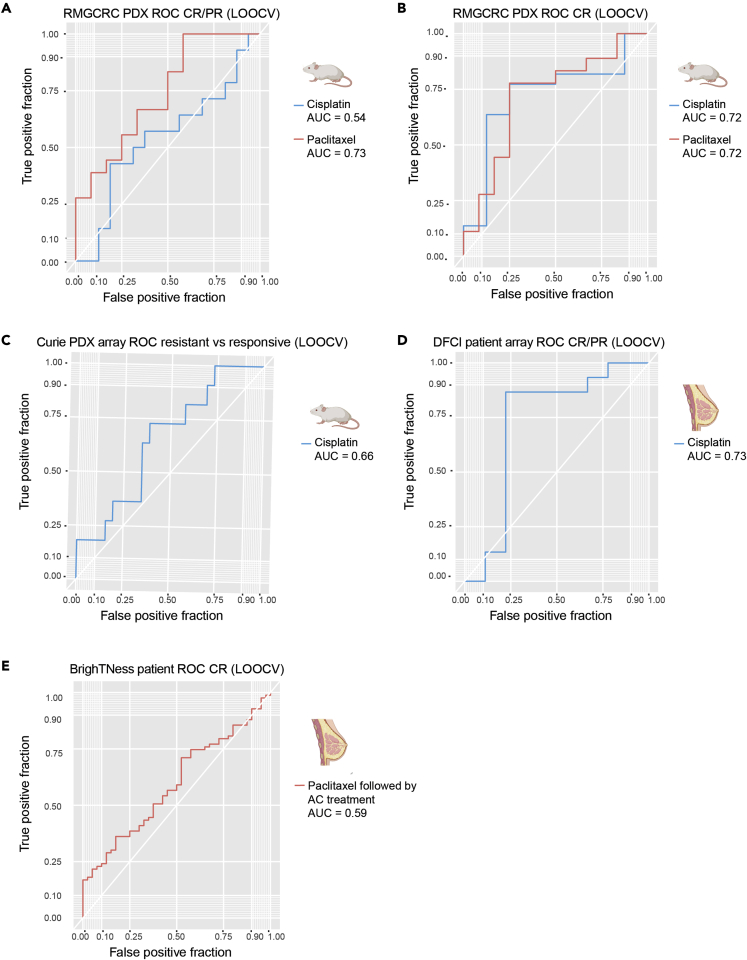
Although systemic chemotherapy remains the standard of care for TNBC, even combination chemotherapy is often ineffective. The identification of biomarkers for differential chemotherapy response would allow for the selection of responsive patients, thus maximizing efficacy and minimizing toxicities. Here, we leverage TNBC PDXs to identify biomarkers of response. To demonstrate their ability to function as a preclinical cohort, PDXs were characterized using DNA sequencing, transcriptomics, and proteomics to show consistency with clinical samples. We then developed a network-based approach (CTD/WGCNA) to identify biomarkers of response to carboplatin (MSI1, TMSB15A, ARHGDIB, GGT1, SV2A, SEC14L2, SERPINI1, ADAMTS20, DGKQ) and docetaxel (c, MAGED4, CERS1, ST8SIA2, KIF24, PARPBP). CTD/WGCNA multigene biomarkers are predictive in PDX datasets (RNAseq and Affymetrix) for both taxane- (docetaxel or paclitaxel) and platinum-based (carboplatin or cisplatin) response, thereby demonstrating cross-expression platform and cross-drug class robustness. These biomarkers were also predictive in clinical datasets, thus demonstrating translational potential.

Keywords: Cancer; Immune response; Omics.


Conflict of interest statement

M.T.L is a Founder of, and an uncompensated Limited Partner in, StemMed Ltd., and an uncompensated Manager in StemMed Holdings L.L.C., its General Partner. MTL is also a Founder of, and equity stake holder in, Tvardi Therapeutics Inc. L.E.D. is a compensated employee of StemMed Ltd. Selected BCM PDX models described herein are exclusively licensed to StemMed Ltd., resulting in tangible property royalties to M.T.L. and L.E.D. University of Utah may license the HCI PDX models described herein to for-profit companies, which may result in tangible property royalties to A.L.W. and B.E.W. Washington University has licensed selected PDX to Envigo, which results in tangible property royalties to S.L. He also received research funding from Pfizer, Takeda Oncology, and Zenopharm, independent of this project. S.L. has received license fees from Envigo. He received research funding from Pfizer, Takeda Oncology, and Zenopharm, outside of this project. O.S, is a compensated employee of, and equity stake holder in, Bluebird Bio. M.J.E. received consulting fees from Abbvie, Sermonix, Pfizer, AstraZeneca, Celgene, NanoString, Puma, Veracyte, Eli Lilly, and Novartis, and he is an equity stockholder and Board of Directors member of BioClassifier. M.J.E. is an inventor on a patent for the Breast Cancer PAM50-based assay, Prosigna, which is marketed by Veracyte. M.J.E. also receives royalties from Washington University in St Louis when the WHIM PDX lines are licensed to for-profit companies.

Figures

None
Graphical abstract
Figure 1
Figure 1
Copy number variation is quantitatively and qualitatively similar in TNBC PDX models and TNBC clinical samples (A) Copy number variation comparison between the PDXs and the TNBC clinical samples in TCGA with a heatmap. (B) Hierarchical clustering of PDXs among the TCGA TNBC samples with copy number variations to illustrate the distribution of PDX models within human clinical samples. PDX samples are in red, and TCGA samples are in black.
Figure 2
Figure 2
Mutational load is similar in TNBC PDXs and TNBC clinical samples (A) Mutational load plot of PDX models and TNBC TCGA samples show similar mutational profiles in highly mutated genes. (B)Waterfall plot showing the distribution of the types of mutations found in the PDX models.
Figure 3
Figure 3
Deep RNAseq and proteomics reveal similarities between PDX models and TCGA clinical breast cancer samples (A) Hierarchical clustering of TCGA and PDX models over the PAM50 gene signature. (B) Hierarchical clustering of TCGA and PDX models over the top 1,000 most variable proteins.
Figure 4
Figure 4
CTD connects the dots to identify multigene biomarker panels of response to carboplatin and docetaxel (A) CTD is a network method that can be used to “connect the dots” and identify highly connected sets of genes. CTD takes a weighted graph and a set of nodes of interest (gray) and outputs a set of highly connected genes (purple) with a p value of connectedness. (B) Highly connected nodes may be connected through their latent connection to response. (C) CTD carboplatin epithelial submodule 5, which contains 3 informative genes highlighted with a star. (D) CTD docetaxel epithelial submodule 23, which contains one informative gene highlighted with a star. (E) Table of all the informative genes for carboplatin identified with the CTD/WGCNA approach. (F) Table of all the informative genes for docetaxel identified with the CTD/WGCNA approach.
Figure 5
Figure 5
CTD outperforms other feature selection methods when selecting informative genes and is predictive in our PDX cohort (A) Heatmap of informative genes for carboplatin across all PDXs from most responsive (left) to most resistant (right). CR, complete response; PR, partial response; SD, stable disease; PD, progressive disease. (B) Heatmap of informative genes for docetaxel across all PDXs from most responsive (left) to most resistant (right). CR, complete response; PR, partial response; SD, stable disease; PD, progressive disease. (C) Overlap between genes predicted to be informative for carboplatin by commonly used feature selection methods visualized with an UpSet plot. (D) Overlap between genes predicted to be informative for docetaxel by commonly used feature selection methods visualized with an UpSet plot. (E) MAE comparison of 4 different methods (red = CTD/WGCNA approach, lime green = correlation, turquoise = recursive feature extraction, orange WGCNA hub genes, purple = Boruta, pink = F-test, green = mutual information regression). (F) RMSE comparison of 4 different methods (red = CTD/WGCNA approach, lime green = correlation, turquoise = recursive feature extraction, orange WGCNA hub genes, purple = Boruta, pink = F-test, green = mutual information regression).
Figure 6
Figure 6
CTD multigene biomarkers are predictive of qualitative response and are also predictive of the best therapy for each PDX (A) ROC for carboplatin complete response (CR) versus all else. The ROC for the CTD genes is in red, the ROC for WGCNA hub genes is in green, and the ROC for the WGCNA modules is in blue. (B) ROC for carboplatin complete and partial response (CR/PR) versus all else. The ROC for the CTD genes is in red, the ROC for WGCNA hub genes is in green, and the ROC for the WGCNA modules is in blue. (C) ROC for docetaxel complete response (CR) versus all else. The ROC for the CTD genes is in red, the ROC for WGCNA hub genes is in green, and the ROC for the WGCNA modules is in blue. (D) ROC for docetaxel complete and partial response (CR/PR) versus all else. The ROC for the CTD genes is in red, the ROC for WGCNA hub genes is in green, and the ROC for the WGCNA modules is in blue. (E) The best response predictions for all PDXs. If both the actual best therapy and the predicted best therapy is carboplatin, the dot is blue. If both the actual best therapy and the predicted best therapy is docetaxel, the dot is red. If the best therapy and the predicted best therapy do not match, the dot is black. (F) The best response predictions for PDXs that are predicted to have a log2 fold-change difference of at least 2 between their response to carboplatin and their response to platinum. If both the actual best therapy and the predicted best therapy is carboplatin, the dot is blue. If both the actual best therapy and the predicted best therapy is docetaxel, the dot is red. If the best therapy and the predicted best therapy do not match, the dot is black.
Figure 7
Figure 7
Multigene biomarkers are predictive of qualitative response in other PDX datasets and in a clinical human dataset with response to cisplatin (A) ROC of response predictions in the RMGCRC PDX cohort for complete and partial response (CR/PR) versus all else. The ROC for predictions for cisplatin is in blue, and the ROC for predictions to paclitaxel is red. (B) ROC of response predictions in the RMGCRC PDX cohort for complete response (CR) versus all else. The ROC for predictions for cisplatin is in blue, and the ROC for predictions to paclitaxel is red. (C) ROC of response prediction for cisplatin response in the Curie cohort. (D) ROC of response prediction for cisplatin response in a human clinical cohort (DFCI). (E) ROC of response prediction for paclitaxel prediction in the BrighTNess cohort. Note that the response was measured after treatment with AC as well.

References

    1. Mehanna J., Haddad F.G., Eid R., Lambertini M., Kourie H.R. Triple-negative breast cancer: current perspective on the evolving therapeutic landscape. Int. J. Womens Health. 2019;11:431–437. doi: 10.2147/ijwh.s178349. - DOI - PMC - PubMed
    1. Garrido-Castro A.C., Lin N.U., Polyak K. Insights into molecular classifications of triple-negative breast cancer: improving patient selection for treatment. Cancer Discov. 2019;9:176–198. doi: 10.1158/2159-8290.cd-18-1177. - DOI - PMC - PubMed
    1. Lehmann B.D., Pietenpol J.A. Identification and use of biomarkers in treatment strategies for triple-negative breast cancer subtypes: biomarker strategies for triple-negative breast cancer. J. Pathol. 2014;232:142–150. doi: 10.1002/path.4280. - DOI - PMC - PubMed
    1. da Silva J.L., Cardoso Nunes N.C., Izetti P., de Mesquita G.G., de Melo A.C. Triple negative breast cancer: a thorough review of biomarkers. Crit. Rev. Oncol. Hematol. 2020;145:102855. doi: 10.1016/j.critrevonc.2019.102855. - DOI - PubMed
    1. Cocco S., Piezzo M., Calabrese A., Cianniello D., Caputo R., Lauro V.D., Fusco G., Gioia G.d., De Laurentiis M., Licenziato M., Laurentiis M. de. Biomarkers in triple-negative breast cancer: state-of-the-art and future perspectives. Int. J. Mol. Sci. 2020;21:4579. doi: 10.3390/ijms21134579. - DOI - PMC - PubMed

LinkOut - more resources