. 2022 Dec 17;26(1):105829.
doi: 10.1016/j.isci.2022.105829. eCollection 2023 Jan 20.

The prelimbic cortex regulates itch processing by controlling attentional bias

Affiliations

The prelimbic cortex regulates itch processing by controlling attentional bias

Guang-Yan Wu et al. iScience. .

Abstract

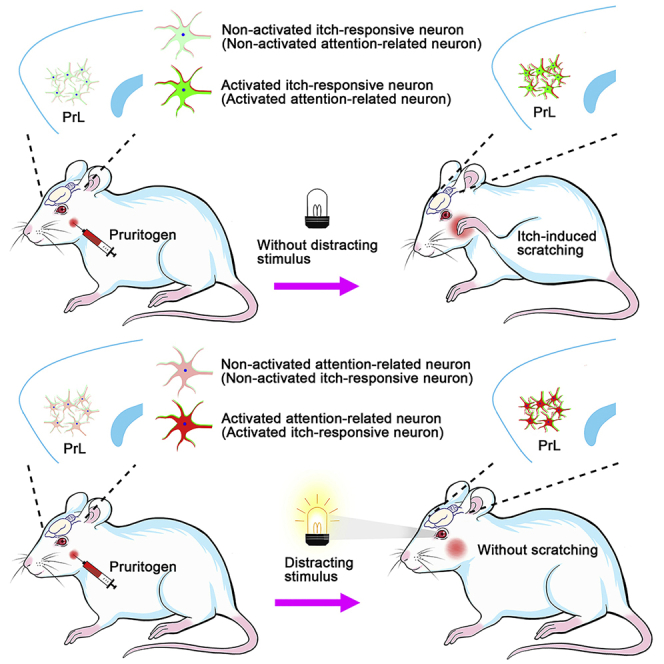
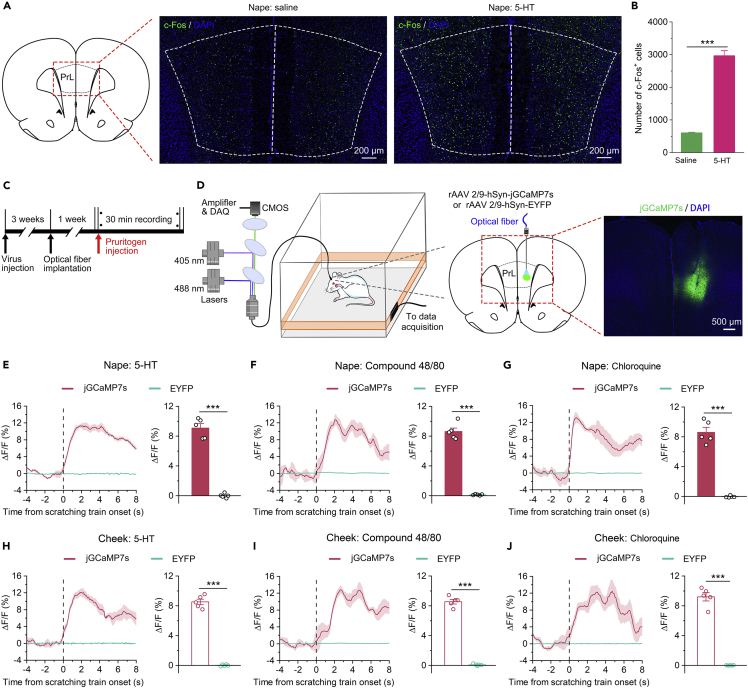
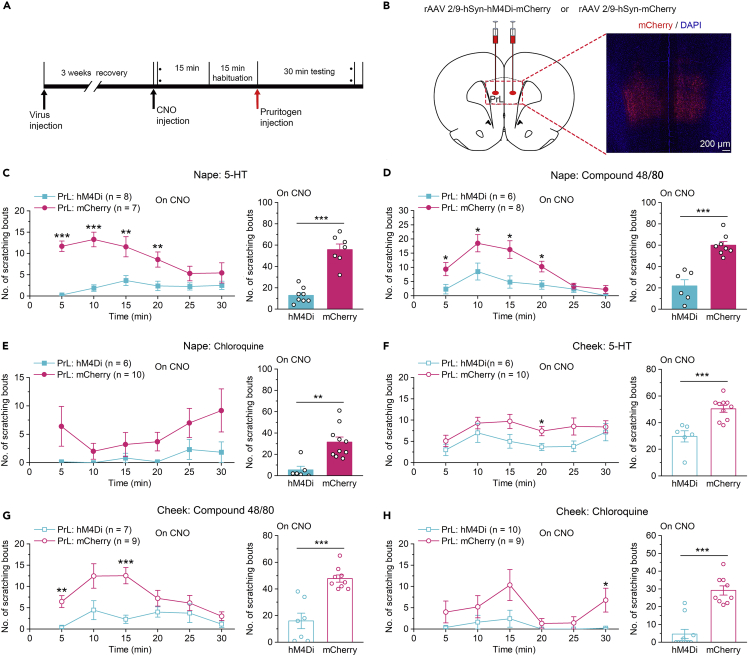
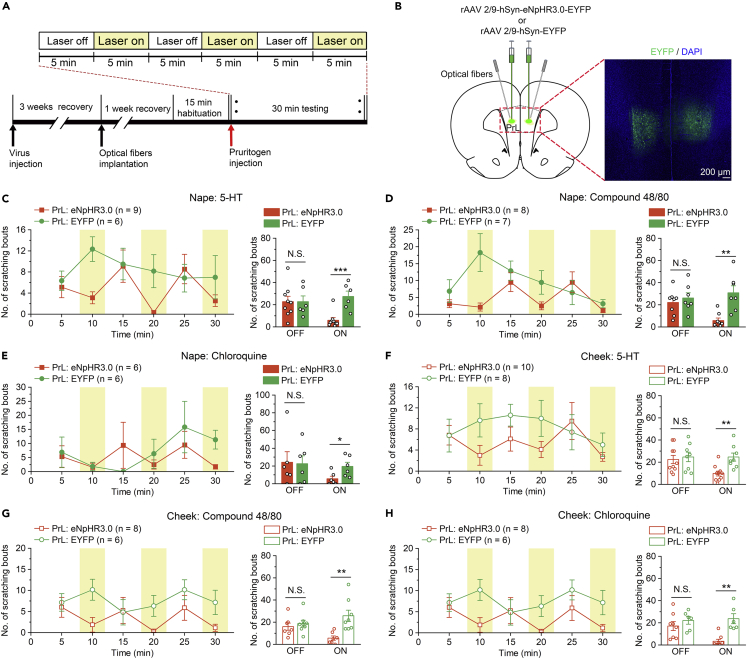
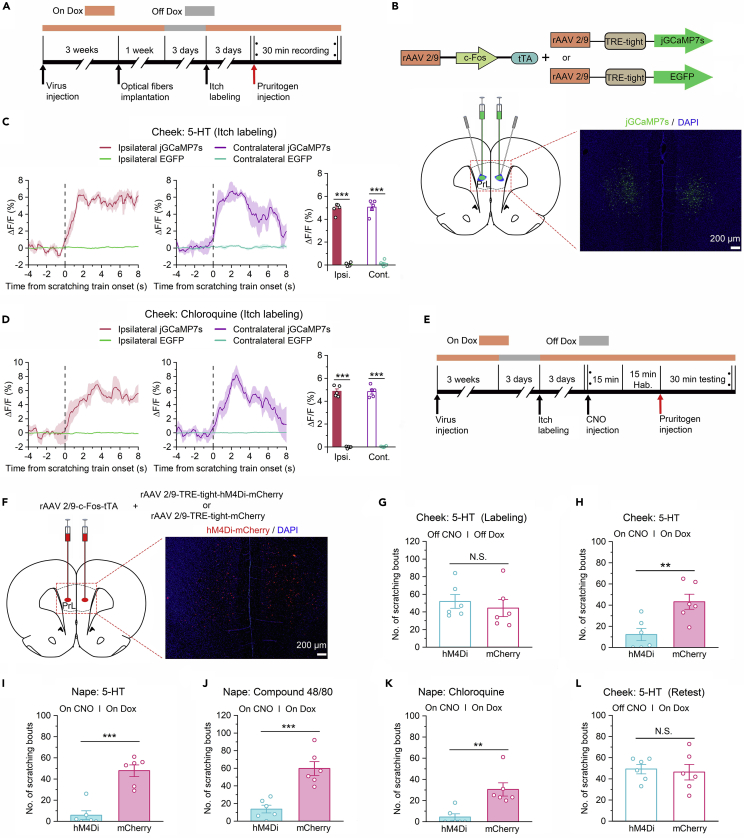
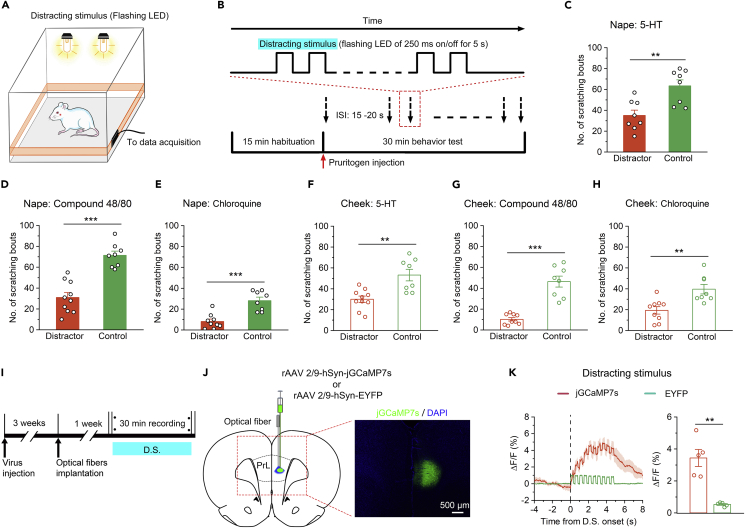
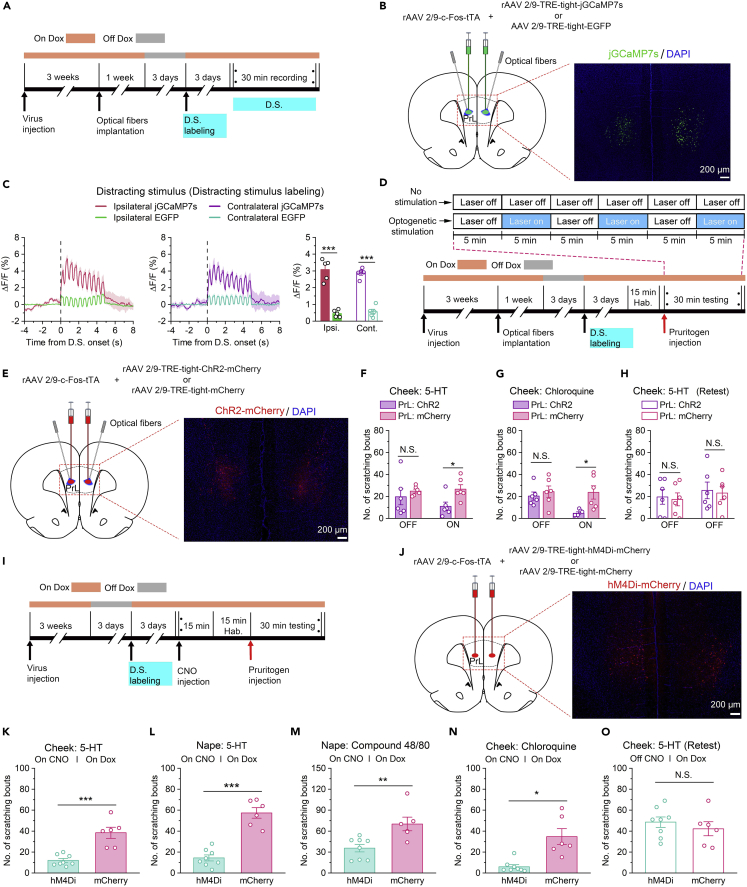
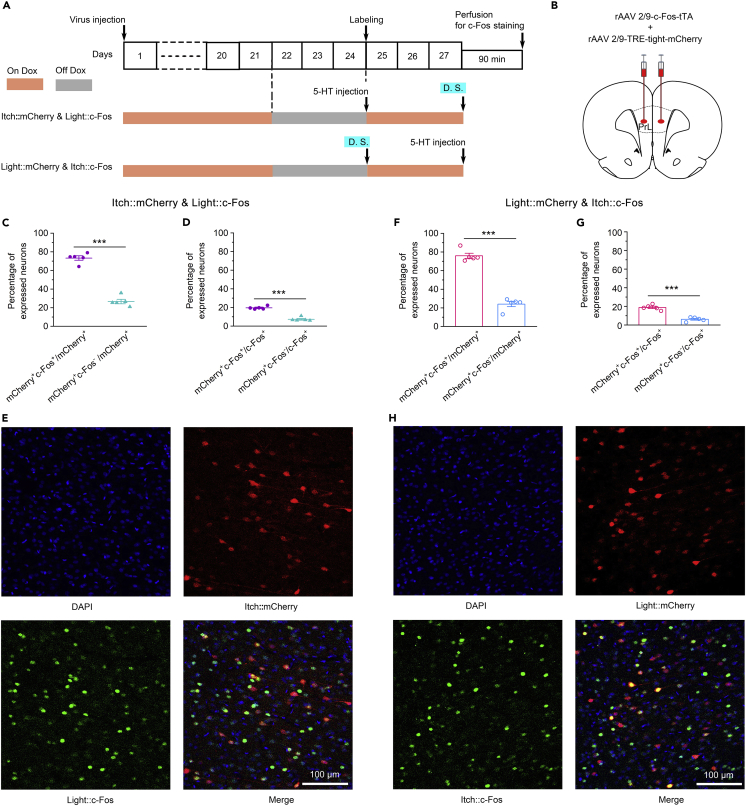
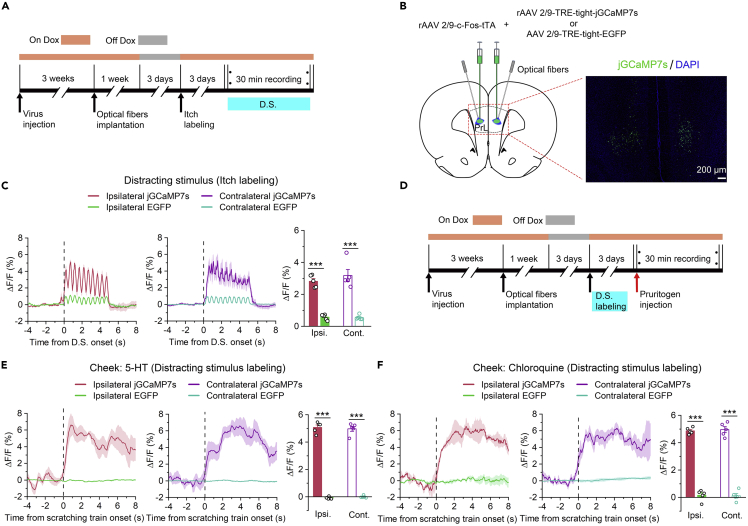
Itch is a complex and unpleasant sensory experience. Recent studies have begun to investigate the neural mechanisms underlying the modulation of sensory and emotional components of itch in the brain. However, the key brain regions and neural mechanism involved in modulating the attentional processing of itch remain elusive. Here, we showed that the prelimbic cortex (PrL) is associated with itch processing and that the manipulation of itch-responsive neurons in the PrL significantly disrupted itch-induced scratching. Interestingly, we found that increasing attentional bias toward a distracting stimulus could disturb itch processing. We also demonstrated the existence of a population of attention-related neurons in the PrL that drive attentional bias to regulate itch processing. Importantly, itch-responsive neurons and attention-related neurons significantly overlapped in the PrL and were mutually interchangeable in the regulation of itch processing at the cellular activity level. Our results revealed that the PrL regulates itch processing by controlling attentional bias.

Keywords: Biological sciences; Cell biology; Neuroscience.


Conflict of interest statement

The authors declare no competing interests.

Figures

None
Graphical abstract
Figure 1
Figure 1
Neural activity in the PrL was significantly enhanced during itch-induced scratching (A) Representative immunofluorescence staining image of c-Fos+ neurons in the PrL after intradermal injection of 5-HT or saline into the nape of the neck. (B) Summary of the data showing the number of c-Fos + neurons in subareas of the PrL. Saline: n = 3 rats; 5-HT: n = 4 rats. (C) Schematic diagram showing the basic experimental timeline of fiber photometry experiments. (D) Left: Schematic illustration of the recording system used to obtain calcium fluorescence signals. Right: Schematic showing the injection of rAAV 2/9-hSyn-jGCaMP7s or rAAV 2/9-hSyn-EYFP and implantation of an optical fiber into the right PrL of the rats. Representative images of jGCaMP7s expression. (E–J) Left: Peri-event plots of the average calcium transients of global PrL neurons in response to itch-scratching induced by intradermal injection of 5-HT (nape, E; cheek, H), compound 48/80 (nape, F; cheek, I), or chloroquine (nape, G; cheek, J). The thick lines and shaded regions indicate the mean ± SEM. Right: Quantification of average jGCaMP7s and EYFP fluorescence changes during itch-induced scratching behaviors (from 0 s to 6 s). n = 5 rats in each group. The data are presented as the mean ± SEM and have a normal distribution. Two-tailed Unpaired Student’s t test; ∗∗∗p < 0.001.
Figure 2
Figure 2
Pharmacogenetic inhibition of the PrLsuppressed itch processing (A) Flow diagram of the basic experimental timeline for chemogenetic inhibition. (B) Schematic showing bilateral injection of rAAV 2/9-hSyn-hM4Di-mCherry or rAAV 2/9-hSyn-mCherry into the PrL of rats (left). Representative images of mCherry expression (right). (C–E) Pharmacogenetic inhibition of the PrL significantly impaired scratching induced by intradermal injection of 5-HT (C), compound 48/80 (D), or chloroquine (E) into the nape of the neck. n = 6–10 rats in each group. (F–H) Pharmacogenetic inhibition of the PrL significantly disrupted scratching induced by intradermal injection of 5-HT (F), compound 48/80 (G), or chloroquine (H) into the cheek. n = 6–10 rats in each group. The data are presented as the mean ± SEM and have a normal distribution. Two-way repeated measures ANOVA followed by the separate one-way ANOVA, or two-tailed Unpaired Student’s t test; ∗p < 0.05, ∗∗p < 0. 01, ∗∗∗p < 0.001.
Figure 3
Figure 3
Optogenetic inhibition of the PrL impaired itch processing (A) Flow diagram of the basic experimental timeline for optogenetic inhibition. (B) Schematic showing injection of rAAV 2/9-hSyn-eNpHR3.0-EYFP or rAAV 2/9-hSyn-EYFP and optical fibers implantation in the bilateral PrL of rats (left). Representative images of EYFP expression (right). (C–E) Optogenetic inhibition of the PrL significantly decreased the scratching bouts induced by intradermal injection of 5-HT (C), compound 48/80 (D), or chloroquine (E) into the nape of the neck. n = 6–9 rats in each group. (F–H) Optogenetic inhibition of the PrL also significantly impaired the scratching induced by intradermal injection of 5-HT (F), compound 48/80 (G), or chloroquine (H) into the cheek. n = 6–10 rats in each group. The data are presented as the mean ± SEM and have a normal distribution. Two-tailed Unpaired Student’s t test; N.S., not significant, ∗p < 0.05, ∗∗p < 0. 01, ∗∗∗p < 0.001.
Figure 4
Figure 4
Pharmacogenetic inhibition of itch-responsive neurons in the PrL impaired itch processing (A) Basic schematic of virus-based activity-dependent labeling and fiber photometry experiments. (B) Upper: Schematic showing the mixture of rAAV 2/9-c-Fos-tTA and rAAV 2/9-TRE-tight-jGCaMP7s (or rAAV 2/9-TRE-tight-EGFP). Lower: Rats were injected with virus mixtures, and optical fibers were bilaterally implanted in the PrL. Representative images of jGCaMP7s expression. (C and D) Left and middle: Mean fluorescent signal of PrL itch-responsive neurons in response to itch-scratching induced by intradermal injection of 5-HT (C) or chloroquine (D). The thick lines and shaded regions indicate the mean ± SEM. Right: Quantification of average jGCaMP7s and EGFP fluorescence changes during itch-induced scratching behaviors (from 0 s to 6 s). n = 5 rats in each group. (E) Basic schematic of virus-based activity-dependent labeling and pharmacogenetic inhibition experiments. (F) Left: Schematic showing bilateral injection of rAAV 2/9-c-Fos-tTA and rAAV 2/9-TRE-tight-hM4Di-mCherry (or rAAV2/9-TRE-tight- mCherry) into the PrL of rats. Right: Representative images of hM4Di-mCherry expression. (G) After 3 days without Dox diet feeding, rats were injected with 5-HT into the cheek to label itch-responsive neurons in the PrL. n = 6 rats in each group. (H–K) Chemogenetic inhibition of itch-responsive neurons significantly decreased the number of scratching bouts induced by intradermal injection of 5-HT (H, cheek; I, nape), compound 48/80 (J, nape), or chloroquine (K, nape). n = 6 rats in each group. (L) Rats were fed with a Dox diet and injected with 5-HT in the absence of CNO to reassess the decrease in the number of scratching bouts resulting from chemogenetic inhibition. n = 6 rats in each group. The data are presented as the mean ± SEM and have a normal distribution. Two-tailed Unpaired Student’s t test; N.S., not significant, ∗∗p < 0. 01, ∗∗∗p < 0.001.
Figure 5
Figure 5
The distracting stimulus significantly disrupted itch processing and increased neural activity in the PrL (A) Schematic diagram showing the recording system used to obtain scratching signals upon exposure to a distracting stimulus. (B) Flow diagram of the distraction manipulations and itch-induced scratching behaviors tests. (C–H) The distracting stimulus significantly impaired scratching behaviors during acute itch induced by intradermal injection of 5-HT (C, nape; F, cheek), compound 48/80 (D, nape; G, cheek), or chloroquine (E, nape; H, cheek). n = 8–10 rats in each group. (I) Flow diagram of fiber photometry experiments. D.S., distracting stimulus. (J) Left: Diagram showing the injection of rAAV 2/9-hSyn-jGCaMP7s or rAAV 2/9-hSyn-EYFP and implantation of an optical fiber into the right PrL of rats. Right: Representative histological images. (K) Left: Peri-event plots of the average calcium transients of global PrL neurons in response to the distracting stimulus. The thick lines and shaded regions indicate the mean ± SEM. Right: Quantification of average jGCaMP7s and EYFP fluorescence changes upon exposure to the distracting stimulus (from 0 s to 5 s). n = 5 rats in each group. The data are presented as the mean ± SEM and have a normal distribution. Two-tailed Unpaired Student’s t test; ∗∗p < 0. 01, ∗∗∗p < 0.001.
Figure 6
Figure 6
Attention-related neurons in the PrL positively regulated itch processing (A) Flow diagram of the basic experimental timeline for attention-related neuron labeling and fiber photometry. D.S., distracting stimulus. (B) Left: Schematic showing bilateral injection of rAAV 2/9-c-Fos-tTA and rAAV 2/9-TRE-tight-jGCaMP7s (or rAAV 2/9-TRE-tight-EGFP) and implantation of optical fibers into the PrL of rats. Right: Representative histological images. (C) Left and middle: Mean fluorescent signal of PrL attention-related neurons in response to the distracting stimulus. The thick lines and shaded regions indicate the mean ± SEM. Right: Quantification of average jGCaMP7s and EGFP fluorescence changes upon exposure to the distracting stimulus (from 0 s to 5 s). n = 5 rats. (D) Flow diagram of the basic experimental timeline for attention-related neuron labeling and optogenetic activation manipulations. D.S., distracting stimulus. (E) Left: Schematic showing injection of rAAV 2/9-c-Fos-tTA mixed with rAAV 2/9-TRE-tight-ChR2-mCherry or rAAV 2/9-TRE-tight-mCherry and implantation of optical fibers in the bilateral PrL of rats. Right: Representative histological images. (F and G) Optogenetic activation of attention-related neurons in the PrL significantly suppressed scratching behaviors during acute itch induced by intradermal injection of 5-HT (cheek, F) or chloroquine (cheek, G). n = 6 rats in each group. (H) Rats fed with a Dox diet were injected with 5-HT in the absence of illumination to reassess the decrease in the number of scratching bouts resulting from optogenetic activation. n = 6 rats in each group. (I) Flow diagram of the basic experimental timeline for attention-related neuron labeling and chemogenetic inhibition manipulations. D.S., distracting stimulus. (J) Left: Schematic showing bilateral injection of rAAV 2/9-c-Fos-tTA and rAAV 2/9-TRE-tight-hM4Di-mCherry (or rAAV 2/9-TRE-tight-mCherry) into the PrL of rats. Right: Representative histological images. (K–N) Chemogenetic inhibition of attention-related neurons significantly impaired scratching behaviors during acute itch induced by intradermal injection of 5-HT (K, cheek; L, nape), compound 48/80 (M, nape) or chloroquine (N, cheek). n = 8 rats in each group. (O) Rats fed with a Dox diet were injected with 5-HT in the absence of CNO to reassess the impairment of itch-induced scratching behaviors resulting from chemogenetic inhibition. n = 8 rats in each group. The data are presented as the mean ± SEM and have a normal distribution. Two-tailed Unpaired Student’s t test; N.S., not significant, ∗p < 0.05, ∗∗p < 0. 01, ∗∗∗p < 0.001.
Figure 7
Figure 7
High overlap between itch-responsive neurons and attention-related neurons in the PrL (A) Flow diagram of the basic experimental timeline for itch-responsive neuron and attention-related neuron labeling. D.S., distracting stimulus. (B) Schematic showing bilateral injection of rAAV 2/9-c-Fos-tTA and rAAV 2/9-TRE-tight-mCherry into the PrL. (C and D) In the itch:mCherry and light:c-Fos expression group, the percentage of double-positive (mCherry+c-Fos+) neurons relative to mCherry+ neurons (C) or c-Fos+ neurons (D) was significantly higher than the percentage of mCherry+c-Fos- neurons. n = 5 rats in each group. (E) Representative images of distracting stimulus-induced endogenous c-Fos expression in the PrL of rats with mCherry+ itch-responsive neurons (itch:mCherry). (F and G) In the light:mCherry and itch:c-Fos expression group, the percentage of double-positive (mCherry+c-Fos+) neurons relative to mCherry+ neurons (F) or c-Fos+ neurons (G) was significantly higher than the percentage of mCherry+c-Fos- neurons. n = 5 rats in each group. (H) Representative images of endogenous c-Fos expression elicited by 5-HT-induced itch in the PrL of rats with mCherry+ attention-related neurons (light:mCherry). The data are presented as the mean ± SEM and have a normal distribution. Two-tailed Unpaired Student’s t test; ∗∗∗p < 0.001.
Figure 8
Figure 8
The functional activation of itch-responsive neurons in the PrL was interchangeable with the functional activation of attention-related neurons (A) Flow diagram of the basic experimental timeline for itch-responsive neuron labeling and fiber photometry. D.S., distracting stimulus. (B) Left: Schematic showing injection of rAAV 2/9-c-Fos-tTA and rAAV 2/9-TRE-tight-jGCaMP7s (or rAAV 2/9-TRE-tight-EGFP) and implantation of optical fibers in the bilateral PrL of rats. Right: representative histological images. (C) Left and middle: Mean fluorescent signal of PrL itch-responsive neurons in response to the distracting stimulus. The thick lines and shaded regions indicate the mean ± SEM. Right: Quantification of average jGCaMP7s and EGFP fluorescence changes upon exposure to the distracting stimulus (from 0 s to 5 s). n = 5 rats in each group. (D) Flow diagram of the basic experimental timeline for attention-related neuron labeling and fiber photometry. D.S., distracting stimulus. (E and F) Left and middle: Mean fluorescent signal of PrL attention-related neurons in response to the itch scratching induced by intradermal injection of 5-HT (E) or chloroquine (F). The thick lines and shaded regions indicate the mean ± SEM. Right: Quantification of average jGCaMP7s and EGFP fluorescence changes upon exposure to the distracting stimulus (from 0 s to 6 s). n = 5 rats in each group. The data are presented as the mean ± SEM and have a normal distribution. Two-tailed Unpaired Student’s t test; ∗∗∗p < 0.001.

Similar articles

Cited by

References

    1. Ikoma A., Steinhoff M., Ständer S., Yosipovitch G., Schmelz M. The neurobiology of itch. Nat. Rev. Neurosci. 2006;7:535–547. - PubMed
    1. LaMotte R.H., Dong X., Ringkamp M. Sensory neurons and circuits mediating itch. Nat. Rev. Neurosci. 2014;15:19–31. - PMC - PubMed
    1. Dhand A., Aminoff M.J. The neurology of itch. Brain. 2014;137:313–322. - PubMed
    1. Ikoma A. Updated neurophysiology of itch. Biol. Pharm. Bull. 2013;36:1235–1240. - PubMed
    1. Dong X., Dong X. Peripheral and central mechanisms of itch. Neuron. 2018;98:482–494. - PMC - PubMed