

Characteristics of intestinal microbiota in C57BL/6 mice with non-alcoholic fatty liver induced by high-fat diet
- PMID: 36620001
- PMCID: PMC9813237
- DOI: 10.3389/fmicb.2022.1051200
Characteristics of intestinal microbiota in C57BL/6 mice with non-alcoholic fatty liver induced by high-fat diet
Abstract
Introduction: As a representation of the gut microbiota, fecal and cecal samples are most often used in human and animal studies, including in non-alcoholic fatty liver disease (NAFLD) research. However, due to the regional structure and function of intestinal microbiota, whether it is representative to use cecal or fecal contents to study intestinal microbiota in the study of NAFLD remains to be shown.
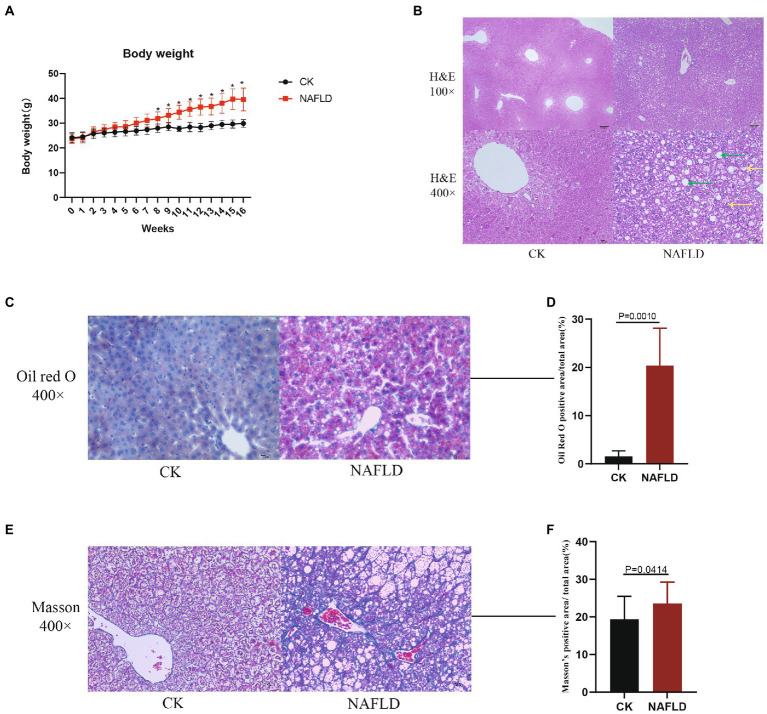
Methods: The NAFLD mouse model was established by high-fat diet induction, and the contents of the jejunum, ileum, cecum, and colon (formed fecal balls) were collected for 16S rRNA gene analysis.
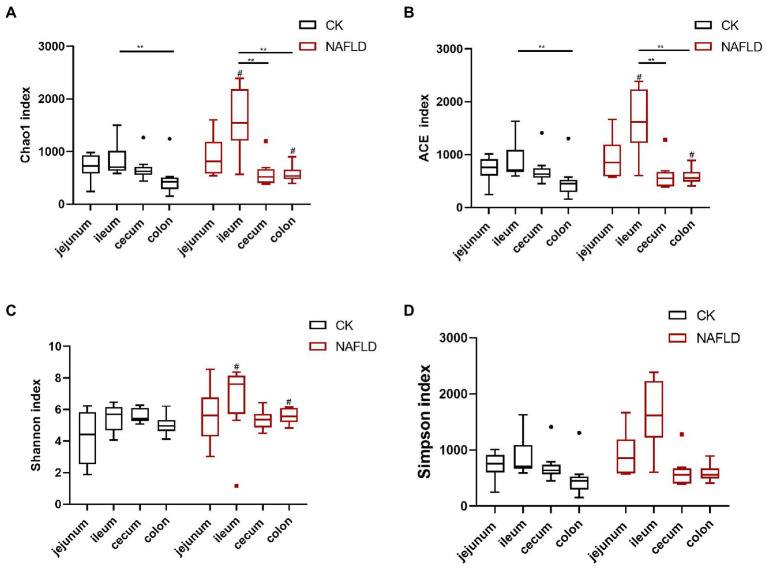
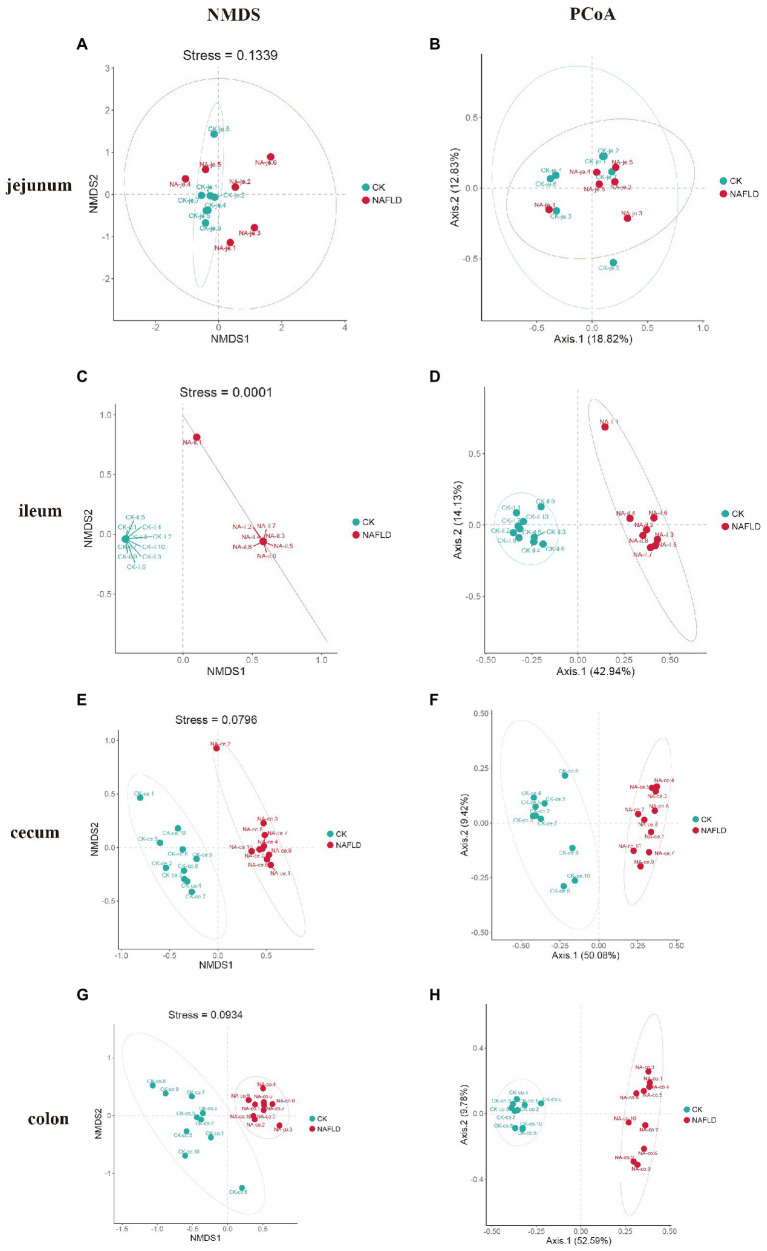
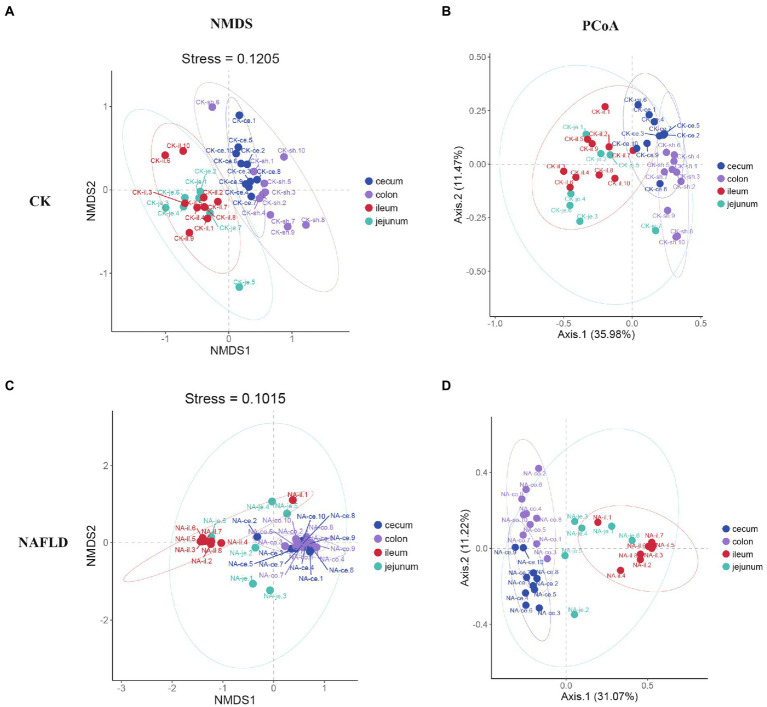
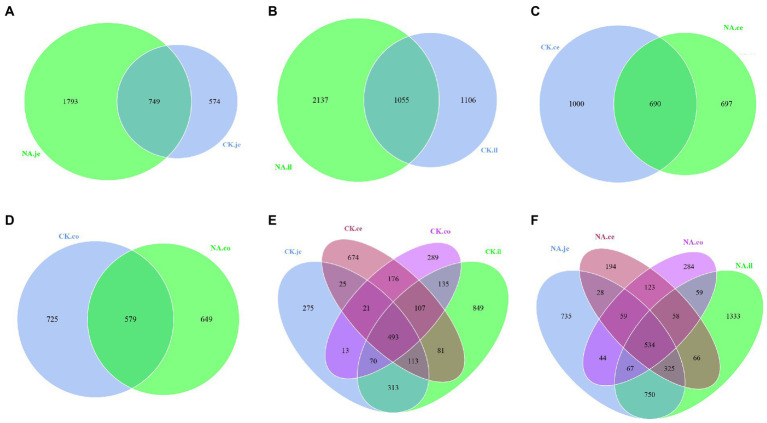
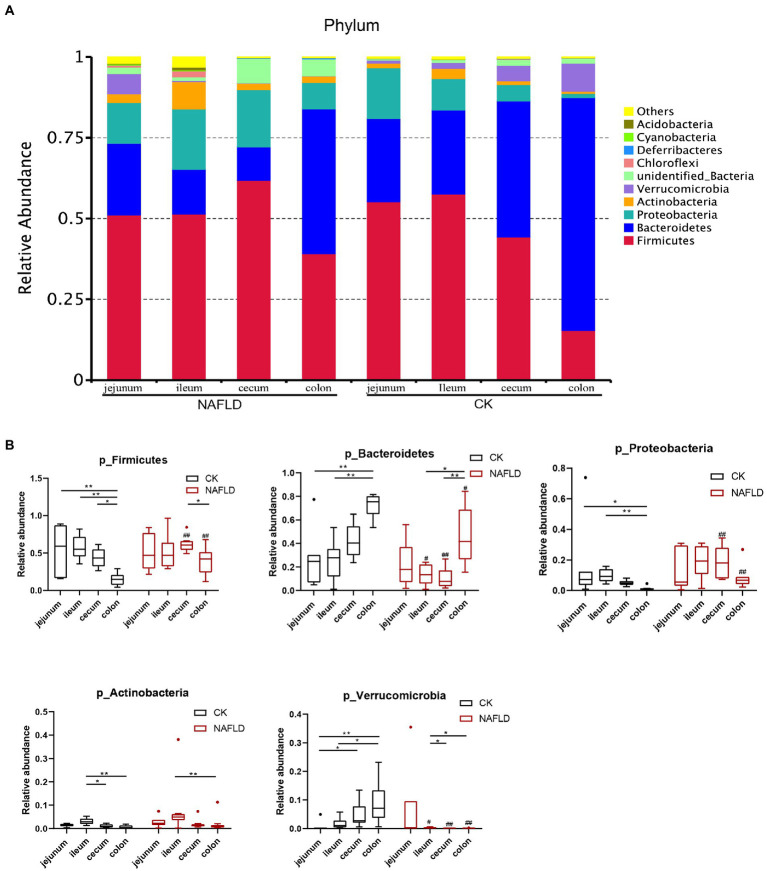
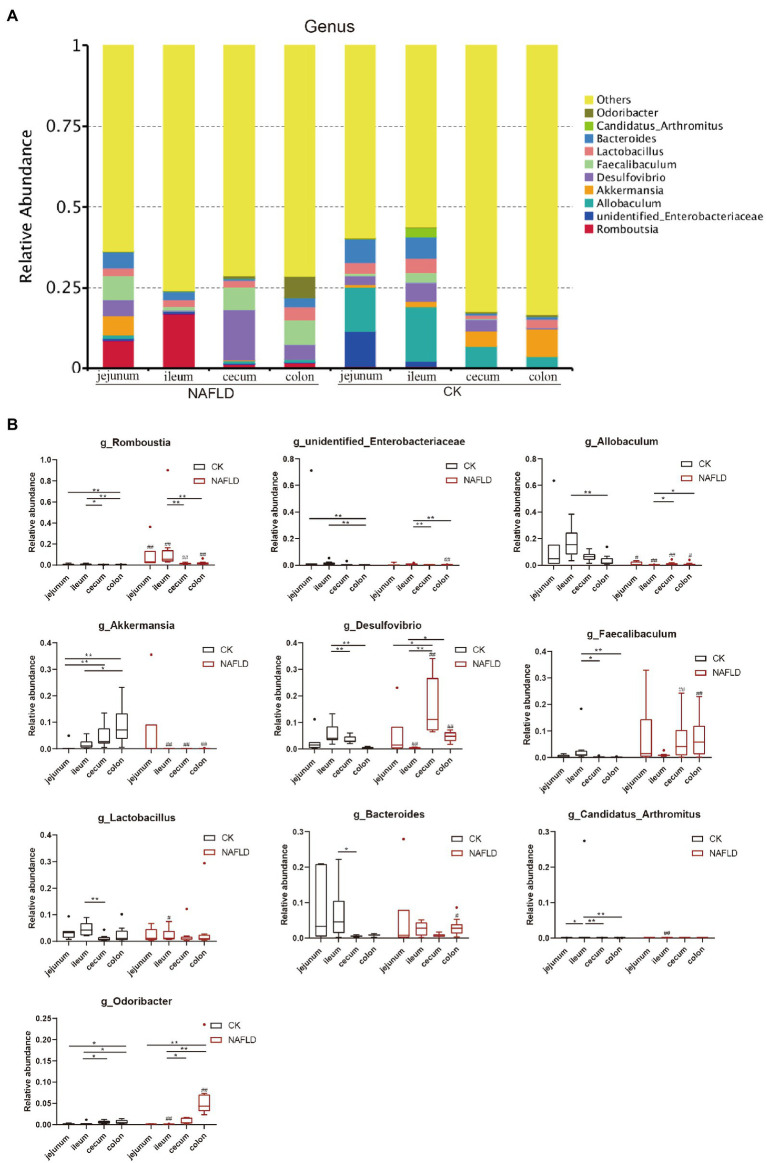
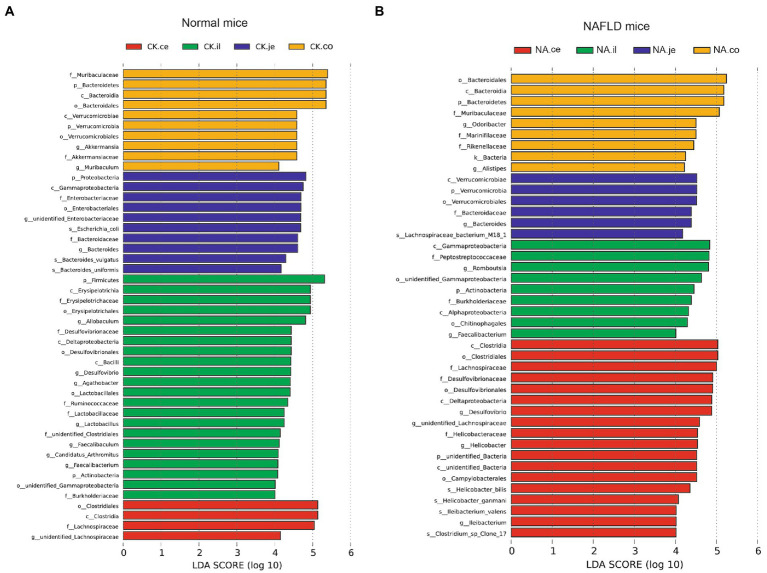
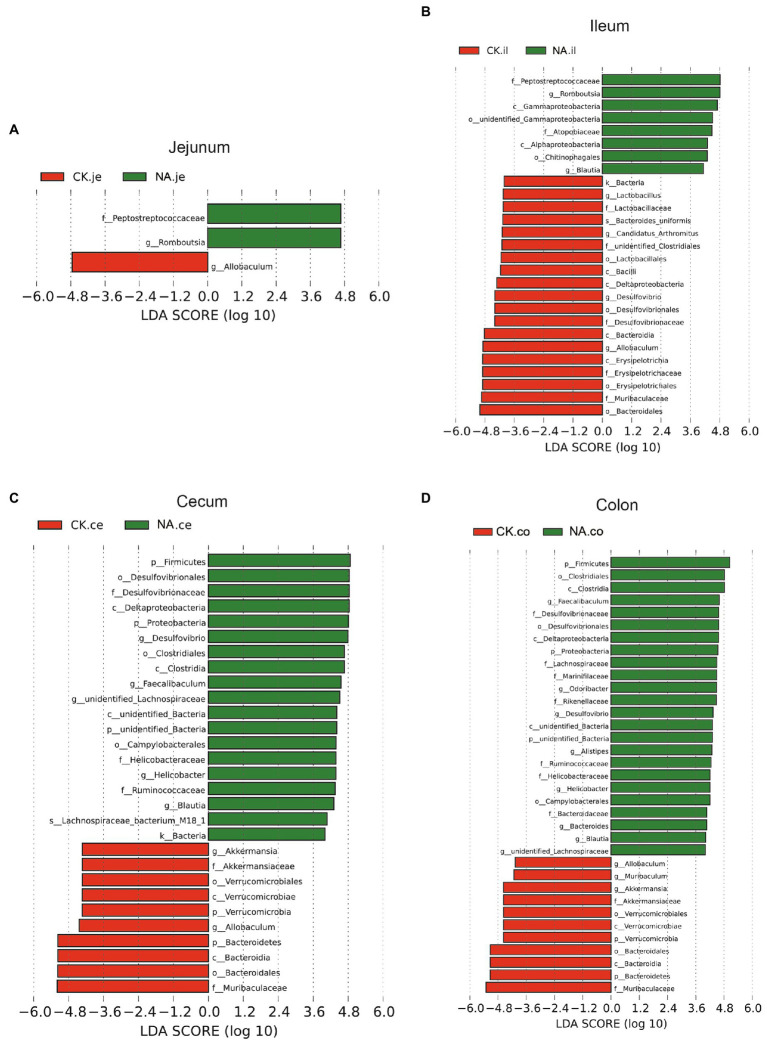
Results: Compared with normal mice, the diversity and the relative abundance of major bacteria and functional genes of the ileum, cecum and colon were significantly changed, but not in the jejunum. In NAFLD mice, the variation characteristics of microbiota in the cecum and colon (feces) were similar. However, the variation characteristics of intestinal microbiota in the ileum and large intestine segments (cecum and colon) were quite different.
Discussion: Therefore, the study results of cecal and colonic (fecal) microbiota cannot completely represent the results of jejunal and ileal microbiota.
Keywords: 16S rDNA sequencing; high-fat diet; intestinal microbiota; mice; non-alcoholic fatty liver disease.
Copyright © 2022 Yan, Li, Wen, Luo, Huang, Chen, Lv, Chen, He, He, Yang, Yu, Xiao, Tang, Li, Han, Zhao, Yu, Kong, Abbasi, Yin and Gu.
Conflict of interest statement
The authors declare that the research was conducted in the absence of any commercial or financial relationships that could be construed as a potential conflict of interest.
Figures
Similar articles
-
Penthorum chinense Pursh. extract attenuates non-alcholic fatty liver disease by regulating gut microbiota and bile acid metabolism in mice.J Ethnopharmacol. 2022 Aug 10;294:115333. doi: 10.1016/j.jep.2022.115333. Epub 2022 Apr 29. J Ethnopharmacol. 2022. PMID: 35500802
-
Spatial heterogeneity of bacterial colonization across different gut segments following inter-species microbiota transplantation.Microbiome. 2020 Nov 18;8(1):161. doi: 10.1186/s40168-020-00917-7. Microbiome. 2020. PMID: 33208178 Free PMC article.
-
Ileal Bile Acid Transporter Inhibitor Improves Hepatic Steatosis by Ameliorating Gut Microbiota Dysbiosis in NAFLD Model Mice.mBio. 2021 Aug 31;12(4):e0115521. doi: 10.1128/mBio.01155-21. Epub 2021 Jul 6. mBio. 2021. PMID: 34225483 Free PMC article.
-
Diet-Independent Correlations between Bacteria and Dysfunction of Gut, Adipose Tissue, and Liver: A Comprehensive Microbiota Analysis in Feces and Mucosa of the Ileum and Colon in Obese Mice with NAFLD.Int J Mol Sci. 2018 Dec 20;20(1):1. doi: 10.3390/ijms20010001. Int J Mol Sci. 2018. PMID: 30577415 Free PMC article.
-
Distribution of gut microbiota across intestinal segments and their impact on human physiological and pathological processes.Cell Biosci. 2025 Apr 16;15(1):47. doi: 10.1186/s13578-025-01385-y. Cell Biosci. 2025. PMID: 40241220 Free PMC article. Review.
Cited by
-
Gut Dysbiosis Shaped by Cocoa Butter-Based Sucrose-Free HFD Leads to Steatohepatitis, and Insulin Resistance in Mice.Nutrients. 2024 Jun 18;16(12):1929. doi: 10.3390/nu16121929. Nutrients. 2024. PMID: 38931284 Free PMC article.
-
Advanced Microbiome Therapeutics Accelerate MASLD Recovery by Restoring Intestinal Microbiota Equilibrium and the Gut-Liver Axis in a Mouse Model.J Agric Food Chem. 2025 Jun 18;73(24):15199-15214. doi: 10.1021/acs.jafc.5c01674. Epub 2025 Jun 6. J Agric Food Chem. 2025. PMID: 40480642
-
New aspects characterizing non-obese NAFLD by the analysis of the intestinal flora and metabolites using a mouse model.mSystems. 2024 Mar 19;9(3):e0102723. doi: 10.1128/msystems.01027-23. Epub 2024 Feb 29. mSystems. 2024. PMID: 38421203 Free PMC article.
-
Segmental patterning of microbiota and immune cells in the murine intestinal tract.Gut Microbes. 2024 Jan-Dec;16(1):2398126. doi: 10.1080/19490976.2024.2398126. Epub 2024 Sep 10. Gut Microbes. 2024. PMID: 39254265 Free PMC article.
-
Exploring the therapeutic potential of silymarin-based herbal remedy (prebiotic) and probiotic blend in a mouse model of NAFLD: Insights into gut microbiota modulation and liver health.Heliyon. 2024 Jun 22;10(12):e33505. doi: 10.1016/j.heliyon.2024.e33505. eCollection 2024 Jun 30. Heliyon. 2024. PMID: 39027434 Free PMC article.
References
LinkOut - more resources
Full Text Sources
Research Materials