

Gut bacteria reflect the adaptation of Diestrammena japanica (Orthoptera: Rhaphidophoridae) to the cave
- PMID: 36620011
- PMCID: PMC9812492
- DOI: 10.3389/fmicb.2022.1016608
Gut bacteria reflect the adaptation of Diestrammena japanica (Orthoptera: Rhaphidophoridae) to the cave
Abstract
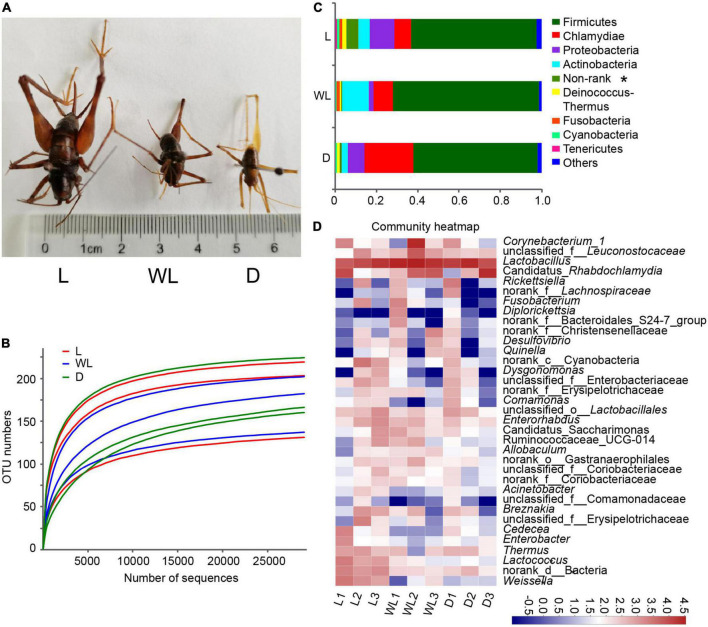
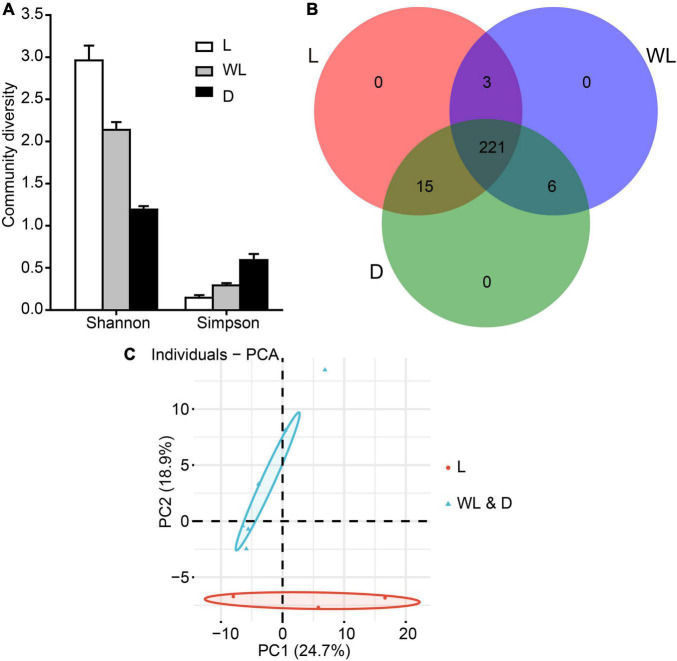
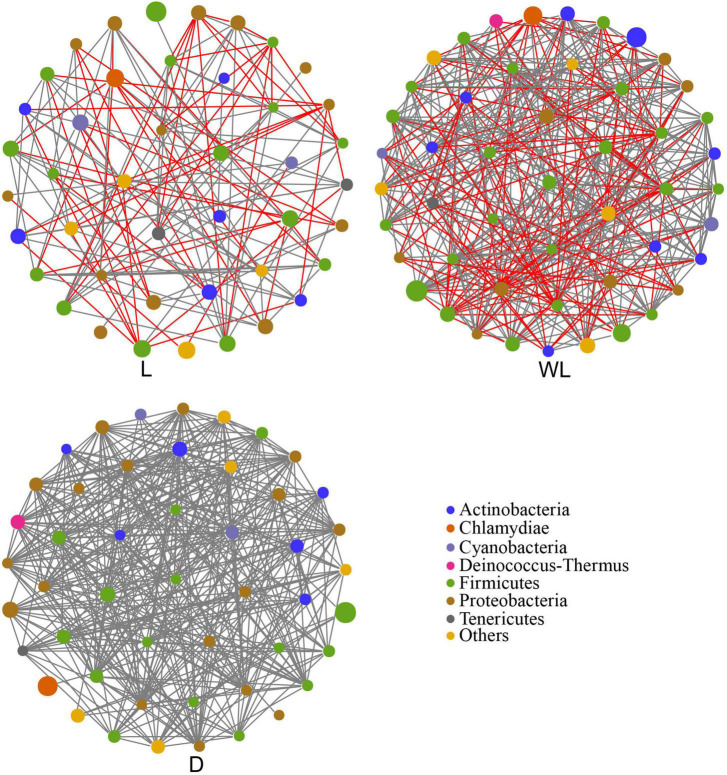
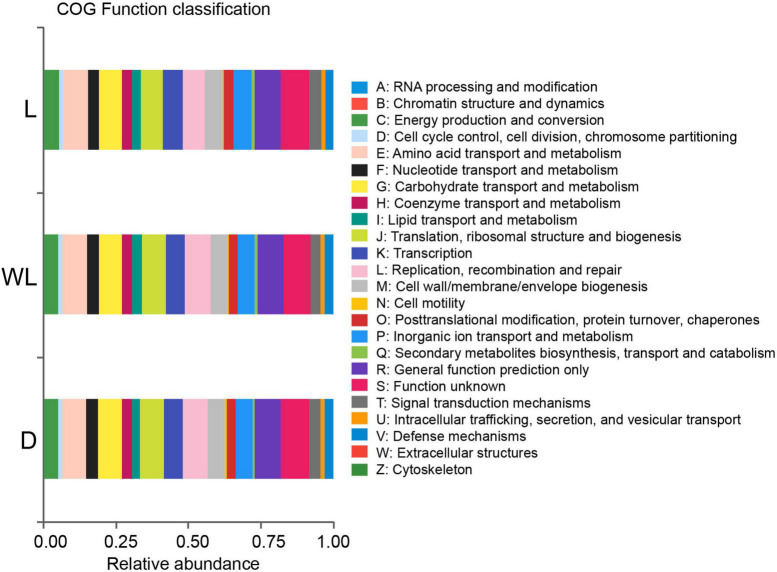
The gut microbiota is essential for the nutrition, growth, and adaptation of the host. Diestrammena japanica, a scavenger that provides energy to the cave ecosystem, is a keystone species in the karst cave in China. It inhabits every region of the cave, regardless of the amount of light. However, its morphology is dependent on the intensity of light. Whether the gut bacteria reflect its adaptation to the cave environment remains unknown. In this research, D. japanica was collected from the light region, weak light region, and dark region of three karst caves. The gut bacterial features of these individuals, including composition, diversity, potential metabolism function, and the co-occurrence network of their gut microbiota, were investigated based on 16S rRNA gene deep sequencing assay. The residues of amino acids in the ingluvies were also evaluated. In addition, we explored the contribution of gut bacteria to the cave adaptation of D. japanica from three various light zones. Findings showed that gut bacteria were made up of 245 operational taxonomic units (OTUs) from nine phyla, with Firmicutes being the most common phylum. Although the composition and diversity of the gut bacterial community of D. japanica were not significantly different among the three light regions, bacterial groups may serve different functions for D. japanica in differing light strengths. D. japanica has a lower rate of metabolism in cave habitats than in light regions. We infer that the majority of gut bacteria are likely engaged in nutrition and supplied D. japanica with essential amino acids. In addition, gut bacteria may play a role in adapting D. japanica's body size. Unveiling the features of the gut bacterial community of D. japanica would shed light on exploring the roles of gut bacteria in adapting hosts to karst cave environments.
Keywords: 16S rRNA gene sequencing; adaptation; amino acid metabolism; cave; gut microbiota; insect; light strength.
Copyright © 2022 Dong, Chen, Fang, Wu, Xiang, Niu, Liu, Tan and Weng.
Conflict of interest statement
The authors declare that the research was conducted in the absence of any commercial or financial relationships that could be construed as a potential conflict of interest.
Figures
Similar articles
-
Co-occurrence pattern and function prediction of bacterial community in Karst cave.BMC Microbiol. 2020 May 29;20(1):137. doi: 10.1186/s12866-020-01806-7. BMC Microbiol. 2020. PMID: 32471344 Free PMC article.
-
Gut microbiome reflect adaptation of earthworms to cave and surface environments.Anim Microbiome. 2022 Aug 5;4(1):47. doi: 10.1186/s42523-022-00200-0. Anim Microbiome. 2022. PMID: 35932082 Free PMC article.
-
Bacteria and Metabolic Potential in Karst Caves Revealed by Intensive Bacterial Cultivation and Genome Assembly.Appl Environ Microbiol. 2021 Feb 26;87(6):e02440-20. doi: 10.1128/AEM.02440-20. Print 2021 Feb 26. Appl Environ Microbiol. 2021. PMID: 33452024 Free PMC article.
-
[Impact of Tourism on Bacterial Communities of Karst Underground River: A Case Study from Two Caves in Fengdu, Chongqing].Huan Jing Ke Xue. 2018 May 8;39(5):2389-2399. doi: 10.13227/j.hjkx.201709005. Huan Jing Ke Xue. 2018. PMID: 29965540 Chinese.
-
The geomicrobiology of limestone, sulfuric acid speleogenetic, and volcanic caves: basic concepts and future perspectives.Front Microbiol. 2024 Mar 20;15:1370520. doi: 10.3389/fmicb.2024.1370520. eCollection 2024. Front Microbiol. 2024. PMID: 38572233 Free PMC article. Review.
Cited by
-
Microorganism Contribution to Mass-Reared Edible Insects: Opportunities and Challenges.Insects. 2024 Aug 13;15(8):611. doi: 10.3390/insects15080611. Insects. 2024. PMID: 39194816 Free PMC article. Review.
References
-
- Andreevskaya M., Johansson P., Jaaskelainen E., Ramo T., Ritari J., Paulin L., et al. (2016). Lactobacillus oligofermentans glucose, ribose and xylose transcriptomes show higher similarity between glucose and xylose catabolism-induced responses in the early exponential growth phase. BMC Genomics 17:539. 10.1186/s12864-016-2840-x - DOI - PMC - PubMed
-
- Barton H. A., Jurado V. (2007). What’s up down there? Microbial diversity in caves. Microbiome 2 132–138.
-
- Busvine J. R. (1980). Insects and hygiene. New York, NY: Springer, 1–20. 10.1007/978-1-4899-3198-6_1 - DOI
Associated data
LinkOut - more resources
Full Text Sources