

New perspectives on an old grouping: The genomic and phenotypic variability of Oxalobacter formigenes and the implications for calcium oxalate stone prevention
- PMID: 36620050
- PMCID: PMC9812493
- DOI: 10.3389/fmicb.2022.1011102
New perspectives on an old grouping: The genomic and phenotypic variability of Oxalobacter formigenes and the implications for calcium oxalate stone prevention
Erratum in
-
Corrigendum: New perspectives on an old grouping: the genomic and phenotypic variability of Oxalobacter formigenes and the implications for calcium oxalate stone prevention.Front Microbiol. 2023 Jun 12;14:1231746. doi: 10.3389/fmicb.2023.1231746. eCollection 2023. Front Microbiol. 2023. PMID: 37378284 Free PMC article.
Abstract
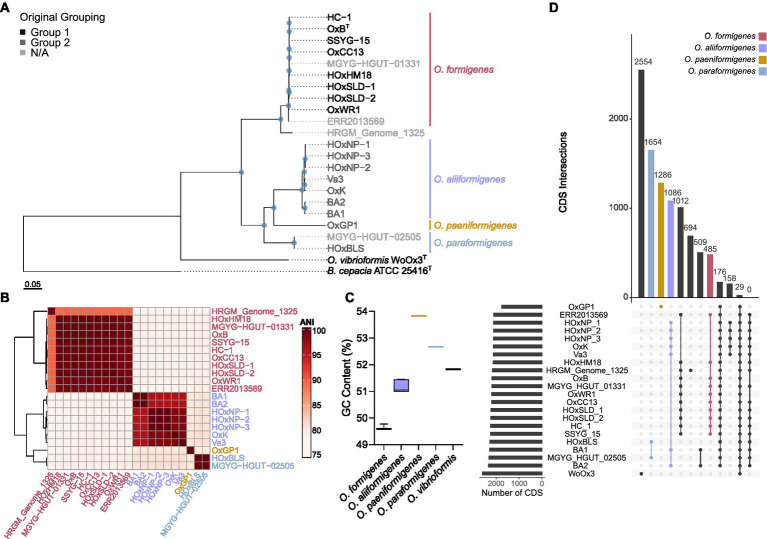
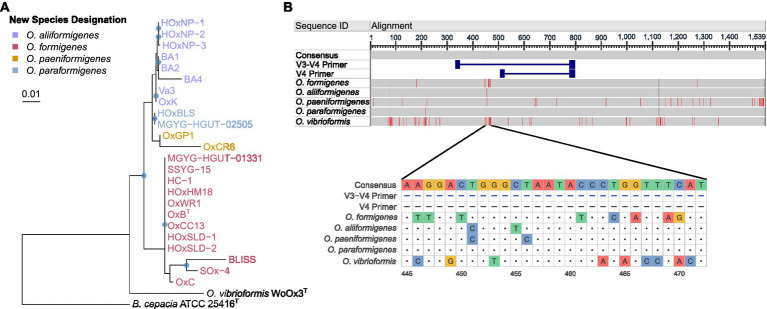
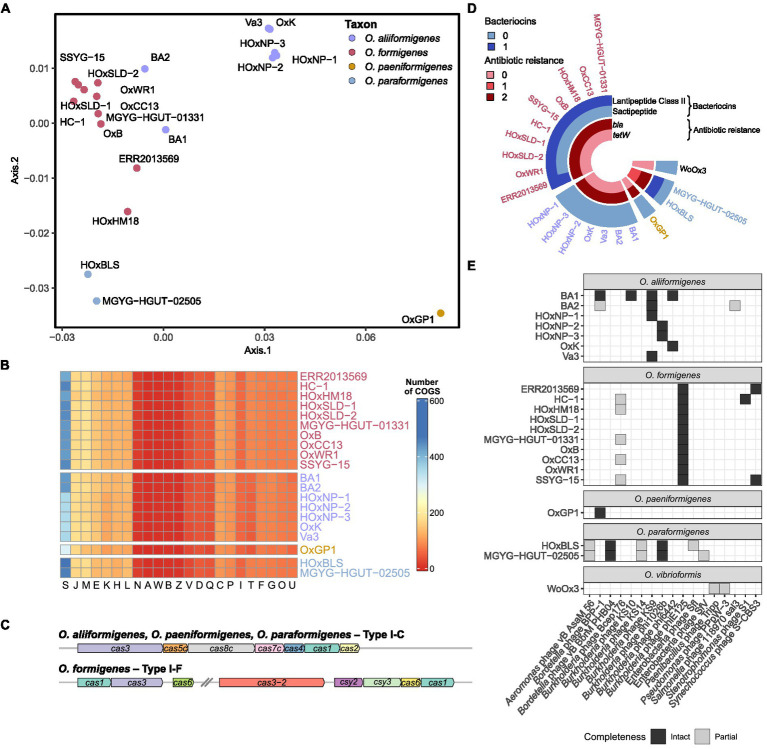
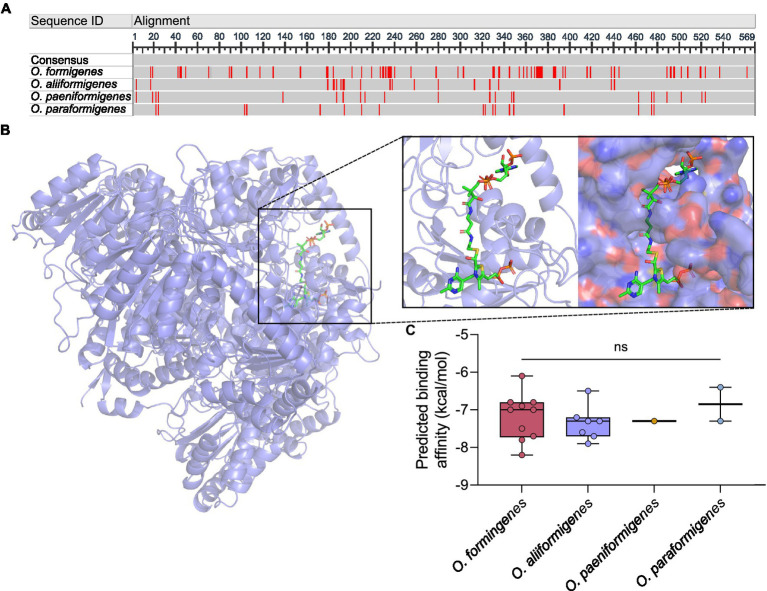
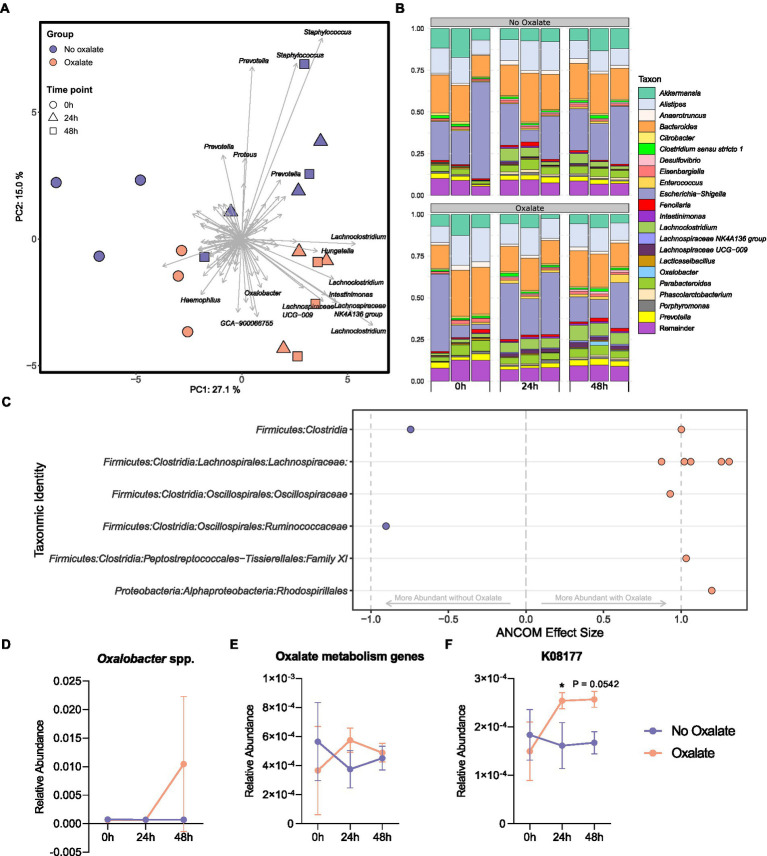
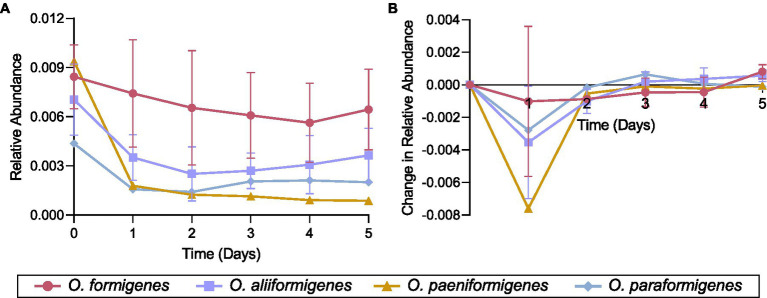
Oxalobacter formigenes is a unique bacterium with the ability to metabolize oxalate as a primary carbon source. Most kidney stones in humans are composed of calcium and oxalate. Therefore, supplementation with an oxalate-degrading bacterium may reduce stone burden in patients suffering from recurrent calcium oxalate-based urolithiasis. Strains of O. formigenes are divided into two groups: group I and group II. However, the differences between strains from each group remain unclear and elucidating these distinctions will provide a better understanding of their physiology and potential clinical applications. Here, genomes from multiple O. formigenes strains underwent whole genome sequencing followed by phylogenetic and functional analyses. Genetic differences suggest that the O. formigenes taxon should be divided into an additional three species: Oxalobacter aliiformigenes sp. nov, Oxalobacter paeniformigenes sp. nov, and Oxalobacter paraformigenes sp. nov. Despite the similarities in the oxalyl-CoA gene (oxc), which is essential for oxalate degradation, these strains have multiple unique genetic features that may be potential exploited for clinical use. Further investigation into the growth of these strains in a simulated fecal environment revealed that O. aliiformigenes strains are capable of thriving within the human gut microbiota. O. aliiformigenes may be a better therapeutic candidate than current group I strains (retaining the name O. formigenes), which have been previously tested and shown to be ineffective as an oral supplement to mitigate stone disease. By performing genomic analyses and identifying these novel characteristics, Oxalobacter strains better suited to mitigation of calcium oxalate-based urolithiasis may be identified in the future.
Keywords: Oxalobacter formigenes; gut microbiome; kidney stone disease; nephrolithiasis and hyperoxaluria; oxalate degradation; phylogenomic and comparative genomic analyses; revised taxonomy.
Copyright © 2022 Chmiel, Carr, Stuivenberg, Venema, Chanyi, Al, Giguere, Say, Akouris, Domínguez Romero, Kwong, Tai, Koval, Razvi, Bjazevic and Burton.
Conflict of interest statement
The authors declare that the research was conducted in the absence of any commercial or financial relationships that could be construed as a potential conflict of interest.
Figures
Similar articles
-
Association of intestinal oxalate-degrading bacteria with recurrent calcium kidney stone formation and hyperoxaluria: a case-control study.BJU Int. 2020 Jan;125(1):133-143. doi: 10.1111/bju.14840. Epub 2019 Aug 18. BJU Int. 2020. PMID: 31145528
-
Intestinal Oxalobacter formigenes colonization in calcium oxalate stone formers and its relation to urinary oxalate.J Endourol. 2003 Apr;17(3):173-6. doi: 10.1089/089277903321618743. J Endourol. 2003. PMID: 12803990
-
Forty Years of Oxalobacter formigenes, a Gutsy Oxalate-Degrading Specialist.Appl Environ Microbiol. 2021 Aug 26;87(18):e0054421. doi: 10.1128/AEM.00544-21. Epub 2021 Aug 26. Appl Environ Microbiol. 2021. PMID: 34190610 Free PMC article. Review.
-
Corrigendum: New perspectives on an old grouping: the genomic and phenotypic variability of Oxalobacter formigenes and the implications for calcium oxalate stone prevention.Front Microbiol. 2023 Jun 12;14:1231746. doi: 10.3389/fmicb.2023.1231746. eCollection 2023. Front Microbiol. 2023. PMID: 37378284 Free PMC article.
-
Oxalobacter formigenes and its role in oxalate metabolism in the human gut.FEMS Microbiol Lett. 2004 Jan 15;230(1):1-7. doi: 10.1016/S0378-1097(03)00864-4. FEMS Microbiol Lett. 2004. PMID: 14734158 Review.
Cited by
-
Shotgun metagenomics and computational profiling of the plastisphere microbiome: unveiling the potential of enzymatic production and plastic degradation.Arch Microbiol. 2023 Oct 26;205(11):359. doi: 10.1007/s00203-023-03701-x. Arch Microbiol. 2023. PMID: 37884755
-
Non-lactic acid bacteria probiotics isolated from intestine or various circumstances.Food Sci Biotechnol. 2024 Jun 14;33(9):1997-2007. doi: 10.1007/s10068-024-01608-x. eCollection 2024 Jul. Food Sci Biotechnol. 2024. PMID: 39130655 Free PMC article. Review.
-
Unveiling roles of beneficial gut bacteria and optimal diets for health.Front Microbiol. 2025 Feb 18;16:1527755. doi: 10.3389/fmicb.2025.1527755. eCollection 2025. Front Microbiol. 2025. PMID: 40041870 Free PMC article. Review.
-
Multi-site microbiota alteration is a hallmark of kidney stone formation.Microbiome. 2023 Nov 25;11(1):263. doi: 10.1186/s40168-023-01703-x. Microbiome. 2023. PMID: 38007438 Free PMC article.
-
Unraveling the role of gut microbiota by fecal microbiota transplantation in rat model of kidney stone disease.Sci Rep. 2024 Sep 20;14(1):21924. doi: 10.1038/s41598-024-72694-4. Sci Rep. 2024. PMID: 39300177 Free PMC article.
References
-
- Al K. F., Bisanz J. E., Gloor G. B., Reid G., Burton J. P. (2018). Evaluation of sampling and storage procedures on preserving the community structure of stool microbiota: a simple at-home toilet-paper collection method. J. Microbiol. Methods 144, 117–121. doi: 10.1016/j.mimet.2017.11.014, PMID: - DOI - PubMed
-
- Andrews S. (2010). FastQC: a quality control tool for high throughput sequence data. Available at: https://www.bioinformatics.babraham.ac.uk/projects/fastqc/ (Accessed June 11, 2022).
LinkOut - more resources
Full Text Sources
Molecular Biology Databases