

Prediction model for knee osteoarthritis using magnetic resonance-based radiomic features from the infrapatellar fat pad: data from the osteoarthritis initiative
- PMID: 36620171
- PMCID: PMC9816749
- DOI: 10.21037/qims-22-368
Prediction model for knee osteoarthritis using magnetic resonance-based radiomic features from the infrapatellar fat pad: data from the osteoarthritis initiative
Abstract
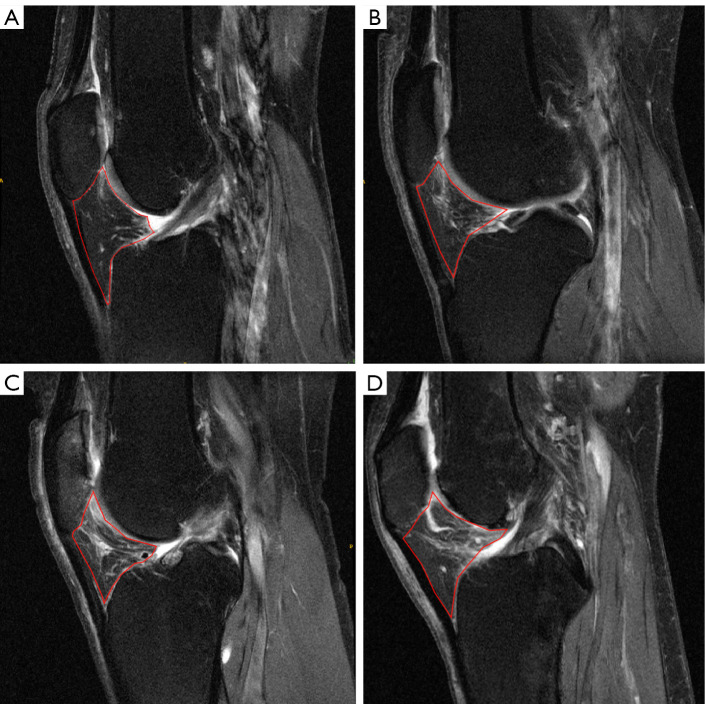
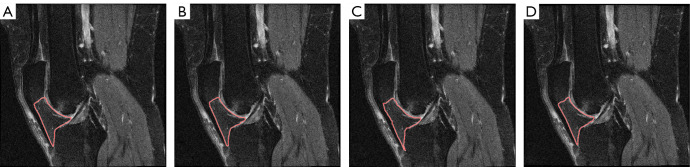
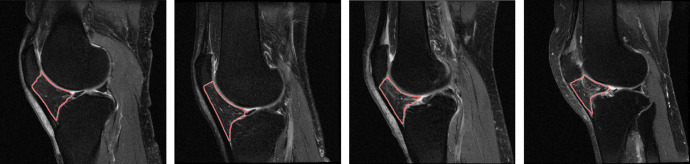
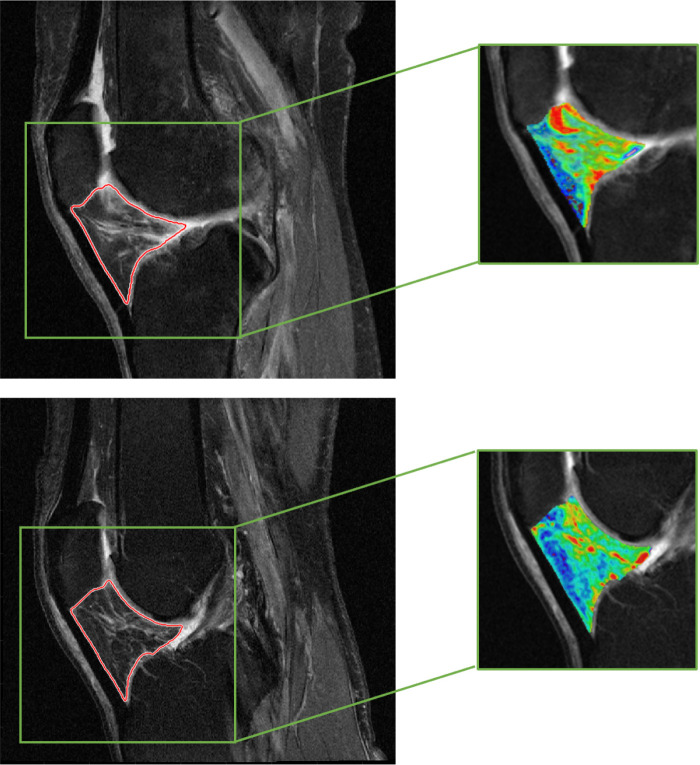
Background: The infrapatellar fat pad (IPFP) plays an important role in the incidence of knee osteoarthritis (OA). Magnetic resonance (MR) signal heterogeneity of the IPFP is related to pathologic changes. In this study, we aimed to investigate whether the IPFP radiomic features have predictive value for incident radiographic knee OA (iROA) 1 year prior to iROA diagnosis.
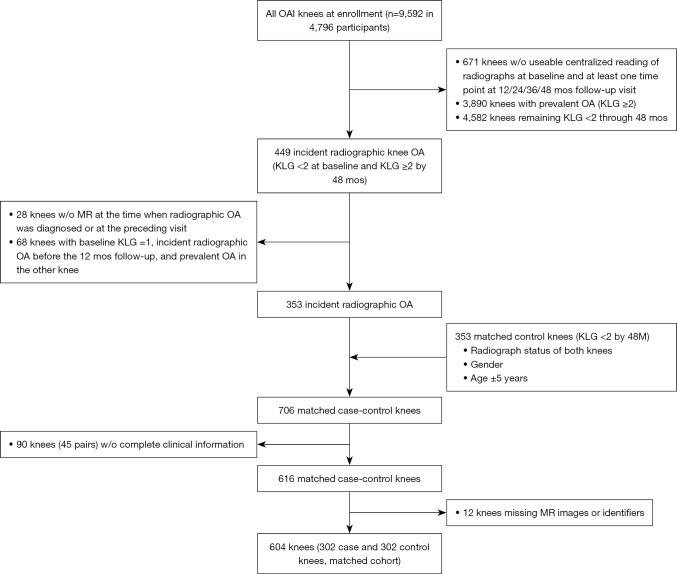
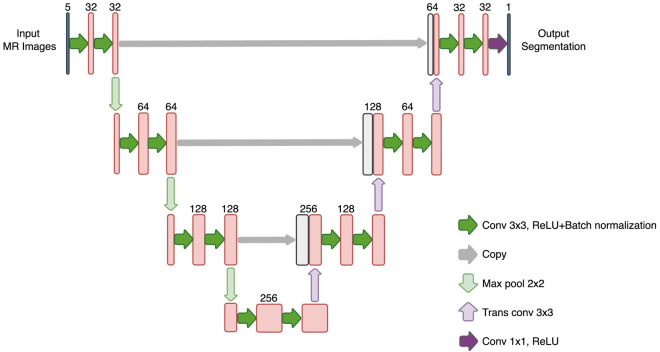
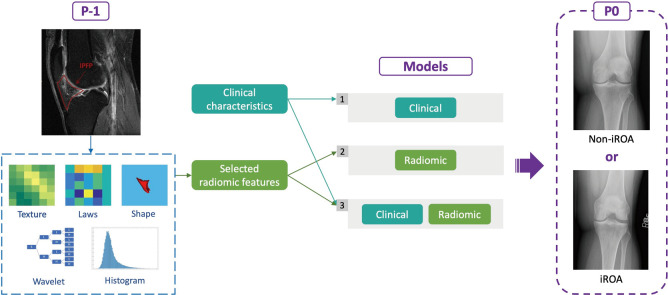
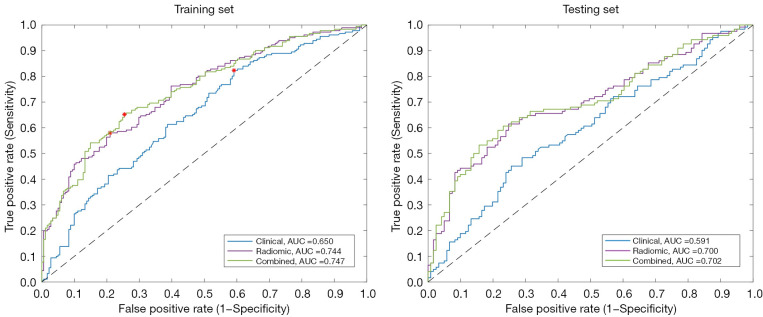
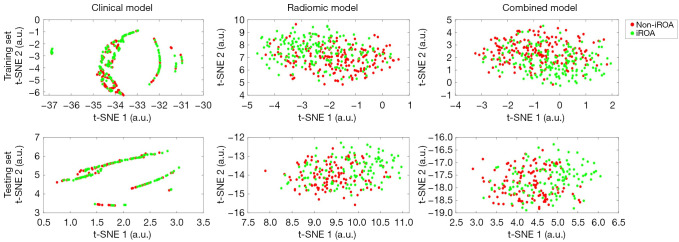
Methods: Data used in this work were obtained from the osteoarthritis initiative (OAI). In this study, iROA was defined as a knee with a baseline Kellgren-Lawrence grade (KLG) of 0 or 1 that further progressed to KLG ≥2 during the follow-up visit. Intermediate-weighted turbo spin-echo knee MR images at the time of iROA diagnosis and 1 year prior were obtained. Five clinical characteristics-age, sex, body mass index, knee injury history, and knee surgery history-were obtained. A total of 604 knees were selected and matched (302 cases and 302 controls). A U-Net segmentation model was independently trained to automatically segment the IPFP. The prediction models were established in the training set (60%). Three main models were generated using (I) clinical characteristics; (II) radiomic features; (III) combined (clinical plus radiomic) features. Model performance was evaluated in an independent testing set (remaining 40%) using the area under the curve (AUC). Two secondary models were also generated using Hoffa-synovitis scores and clinical characteristics.
Results: The comparison between the automated and manual segmentations of the IPFP achieved a Dice coefficient of 0.900 (95% CI: 0.891-0.908), which was comparable to that of experienced radiologists. The radiomic features model and the combined model yielded superior AUCs of 0.700 (95% CI: 0.630-0.763) and 0.702 (95% CI: 0.635-0.763), respectively. The DeLong test found no statistically significant difference between the receiver operating curves of the radiomic and combined models (P=0.831); however, both models outperformed the clinical model (P=0.014 and 0.004, respectively).
Conclusions: Our results demonstrated that radiomic features of the IPFP are predictive of iROA 1 year prior to the diagnosis, suggesting that IPFP radiomic features can serve as an early quantitative prediction biomarker of iROA.
Keywords: Osteoarthritis (OA); infrapatellar fat pad (IPFP); prediction model; radiomics.
2023 Quantitative Imaging in Medicine and Surgery. All rights reserved.
Conflict of interest statement
Conflicts of Interest: All authors have completed the ICMJE uniform disclosure form (available at https://qims.amegroups.com/article/view/10.21037/qims-22-368/coif). KY, LZ, JH, and XZ report that this work was supported by the President Foundation of the Third Affiliated Hospital of Southern Medical University (No. YM2021012). The other authors have no conflicts of interest to declare.
Figures
References
-
- Hunter DJ, Bierma-Zeinstra S. Osteoarthritis. Lancet 2019;393:1745-59. - PubMed
-
- GBD 2017 DALYs and HALE Collaborators. Global, regional, and national disability-adjusted life-years (DALYs) for 359 diseases and injuries and healthy life expectancy (HALE) for 195 countries and territories, 1990-2017: a systematic analysis for the Global Burden of Disease Study 2017. Lancet 2018;392:1859-922. 10.1016/S0140-6736(18)32335-3 - DOI - PMC - PubMed
LinkOut - more resources
Full Text Sources