

Neutrophil extracellular traps-associated modification patterns depict the tumor microenvironment, precision immunotherapy, and prognosis of clear cell renal cell carcinoma
- PMID: 36620592
- PMCID: PMC9813599
- DOI: 10.3389/fonc.2022.1094248
Neutrophil extracellular traps-associated modification patterns depict the tumor microenvironment, precision immunotherapy, and prognosis of clear cell renal cell carcinoma
Abstract
Background: Neutrophil extracellular traps (NETs) are web-like structures formed by neutrophils, and their main function is antimicrobial defense. Moreover, NETs have numerous roles in the pathogenesis and progression of cancers. However, the potential roles of NET-related genes in renal cell carcinoma remain unclear. In this study, we comprehensively investigated the NETs patterns and their relationships with tumor environment (TME), clinicopathological features, prognosis, and prediction of therapeutic benefits in the clear cell renal cell carcinoma (ccRCC) cohort.
Methods: We obtained the gene expression profiles, clinical characteristics, and somatic mutations of patients with ccRCC from The Cancer Genome Atlas database (TCGA), Gene Expression Omnibus (GEO), and ArrayExpress datasets, respectively. ConsensusCluster was performed to identify the NET clusters. The tumor environment scores were evaluated by the "ESTIMATE," "CIBERSORT," and ssGSEA methods. The differential analysis was performed by the "limma" R package. The NET-scores were constructed based on the differentially expressed genes (DEGs) among the three cluster patterns using the ssGSEA method. The roles of NET scores in the prediction of immunotherapy were investigated by Immunophenoscores (TCIA database) and validated in two independent cohorts (GSE135222 and IMvigor210). The prediction of targeted drug benefits was implemented using the "pRRophetic" and Gene Set Cancer Analysis (GSCA) datasets. Real-time quantitative reverse transcription polymerase chain reaction (RT-PCR) was performed to identify the reliability of the core genes' expression in kidney cancer cells.
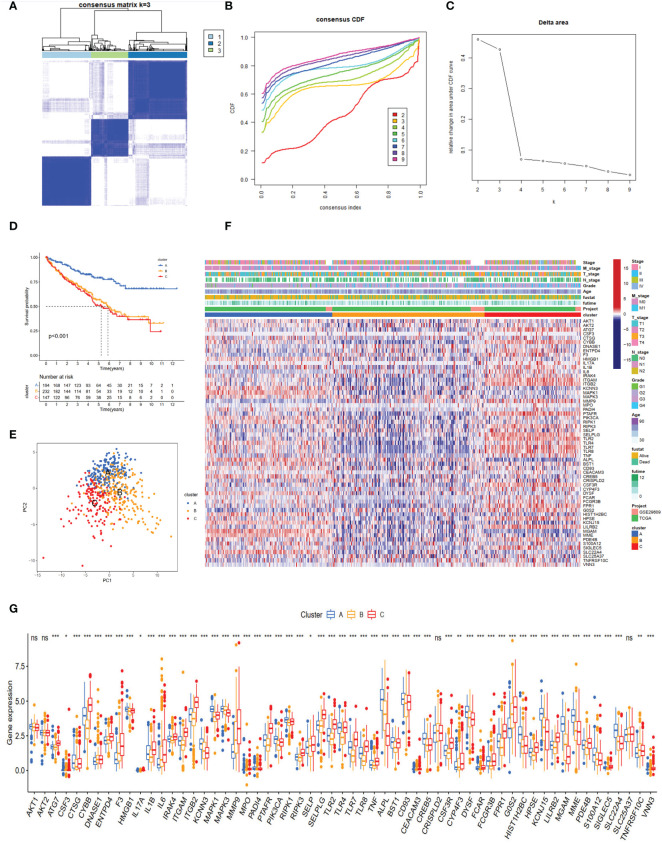
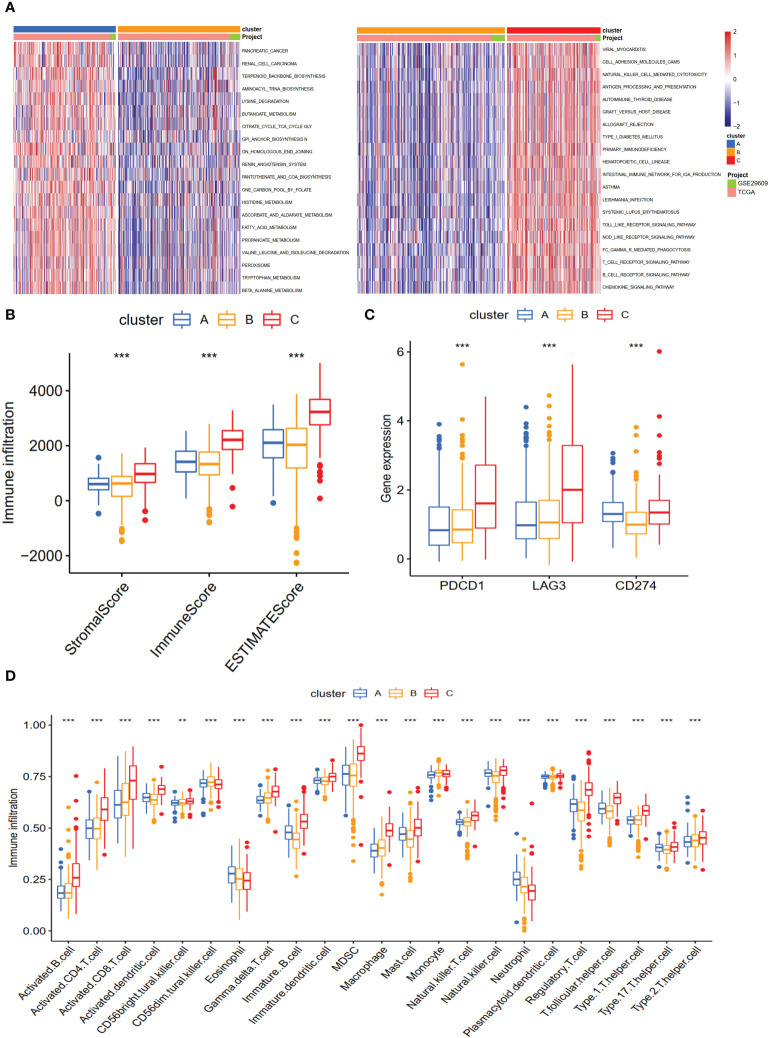
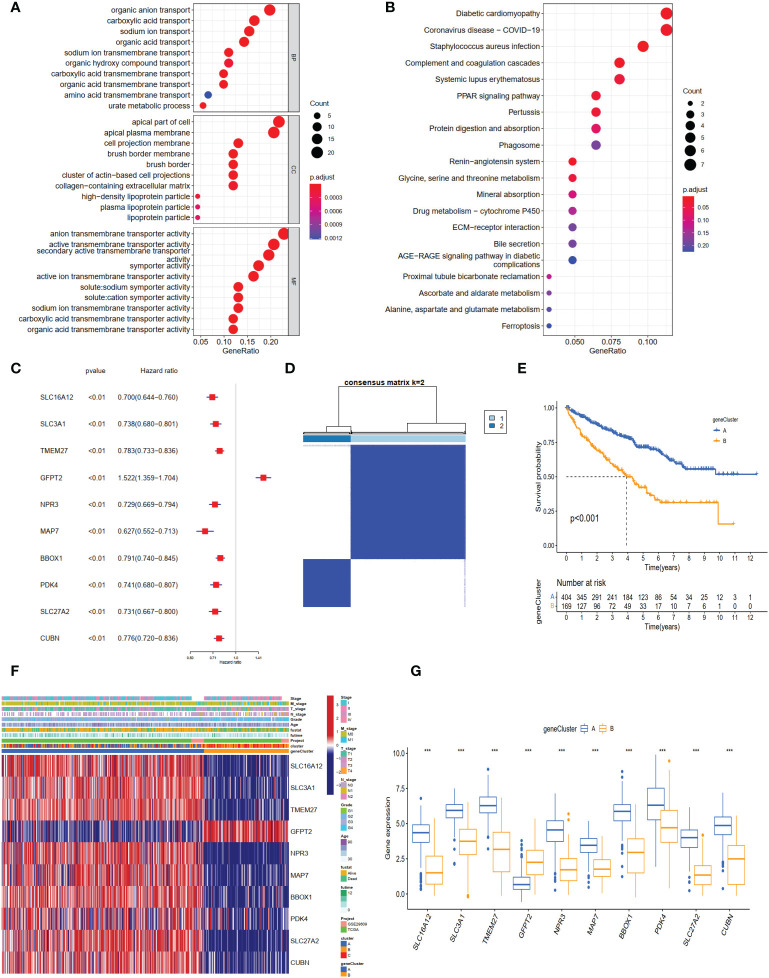
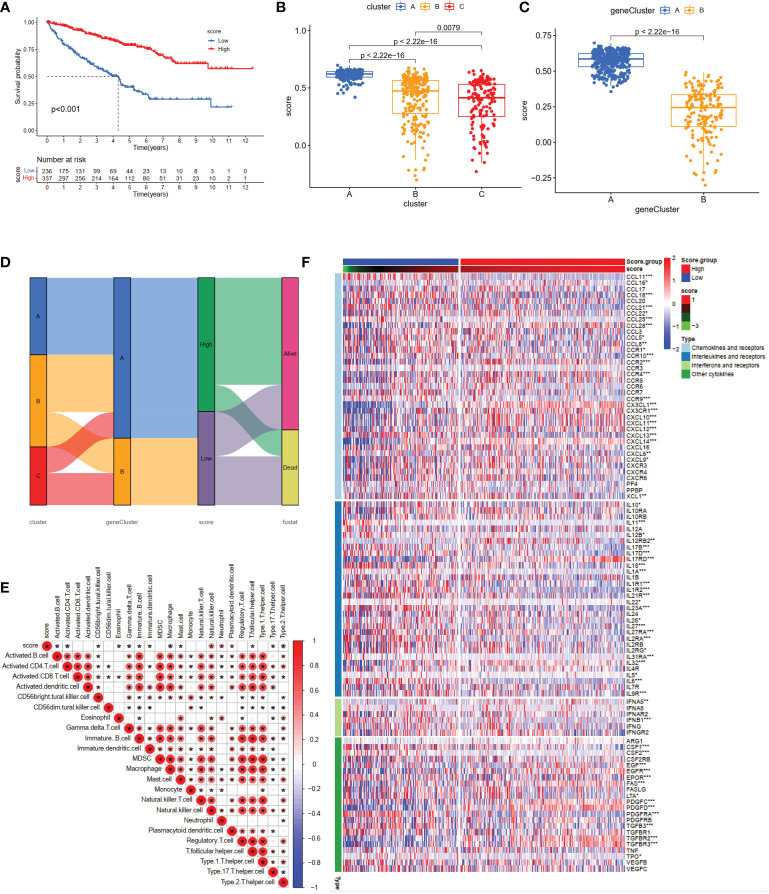
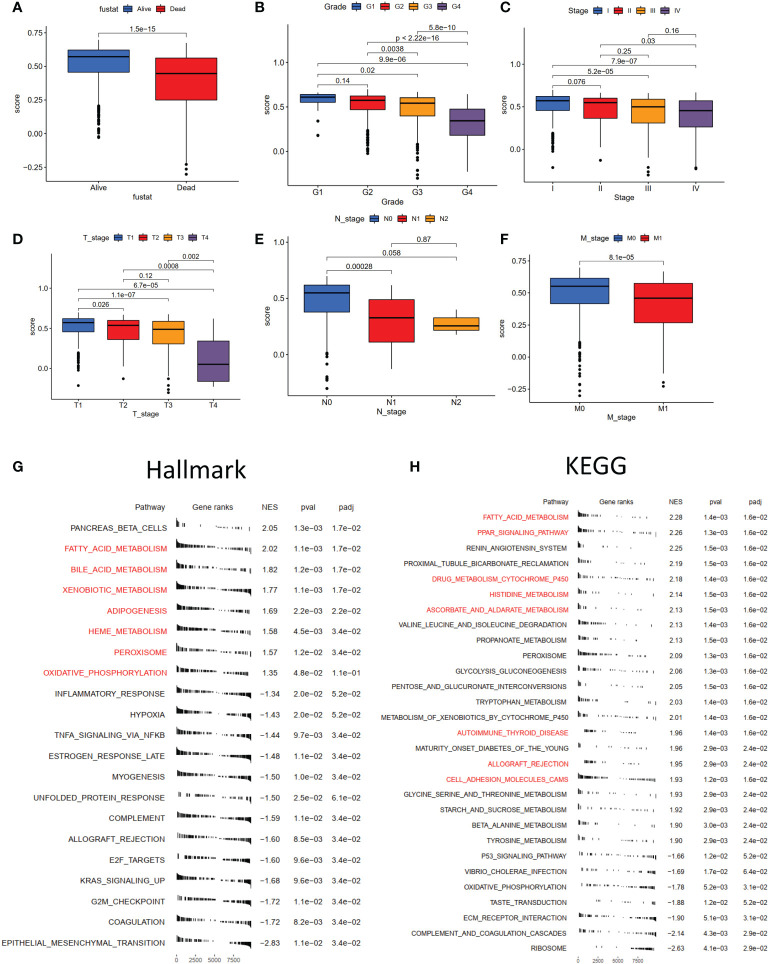
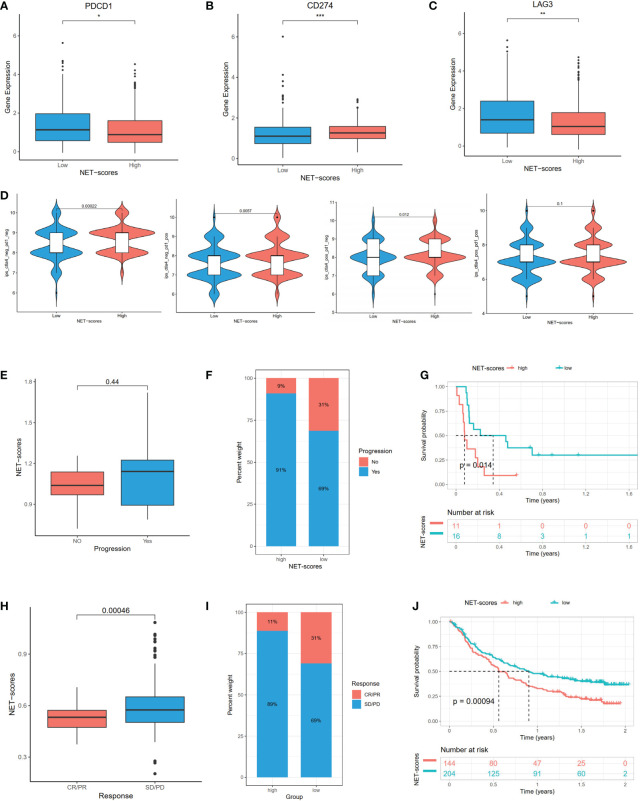
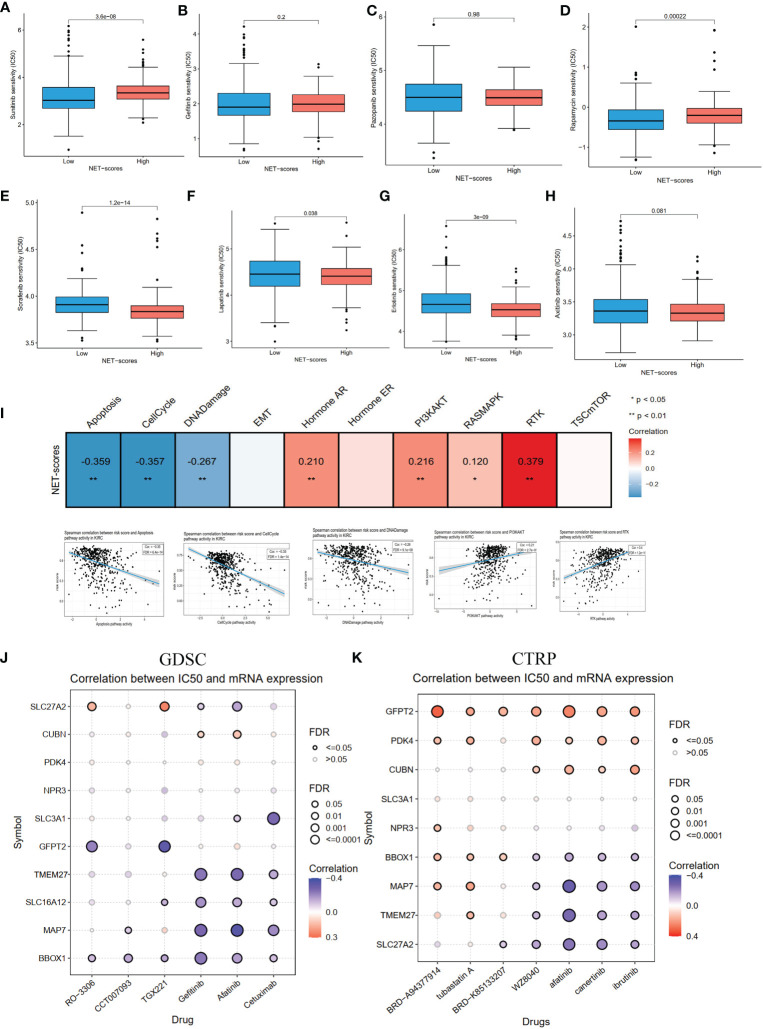
Results: Three NET-related clusters were identified in the ccRCC cohort. The patients in Cluster A had more metabolism-associated pathways and better overall survival outcomes, whereas the patients in Cluster C had more immune-related pathways, a higher immune score, and a poorer prognosis than those in Cluster B. Based on the DEGs among different subtypes, patients with ccRCC were divided into two gene clusters. These gene clusters demonstrated significantly different immune statuses and clinical features. The NET scores were calculated based on the ten core genes by the Gene Set Variation Analysis (GSVA) package and then divided ccRCC patients into two risk groups. We observed that high NET scores were associated with favorable survival outcomes, which were validated in the E-MTAB-1980 dataset. Moreover, the NET scores were significantly associated with immune cell infiltration, targeted drug response, and immunotherapy benefits. Subsequently, we explored the expression profiles, methylation, mutation, and survival prediction of the 10 core genes in TCGA-KIRC. Though all of them were associated with survival information, only four out of the 10 core genes were differentially expressed genes in tumor samples compared to normal tissues. Finally, RT-PCR showed that MAP7, SLC16A12, and SLC27A2 decreased, while SLC3A1 increased, in cancer cells.
Conclusion: NETs play significant roles in the tumor immune microenvironment of ccRCC. Identifying NET clusters and scores could enhance our understanding of the heterogeneity of ccRCC, thus providing novel insights for precise individual treatment.
Keywords: ccRCC; immune tumor environment; neutrophil extracellular traps; prognosis; subtypes.
Copyright © 2022 Teng, Li, Li, Wang, Han and Zhang.
Conflict of interest statement
The authors declare that the research was conducted in the absence of any commercial or financial relationships that could be construed as a potential conflict of interest.
Figures
Similar articles
-
Prognostic value of neutrophil extracellular trap signature in clear cell renal cell carcinoma.Front Oncol. 2023 Jul 13;13:1205713. doi: 10.3389/fonc.2023.1205713. eCollection 2023. Front Oncol. 2023. PMID: 37519809 Free PMC article.
-
Construction of the metabolic reprogramming-associated gene signature for clear cell renal cell carcinoma prognosis prediction.BMC Urol. 2023 Sep 15;23(1):147. doi: 10.1186/s12894-023-01317-3. BMC Urol. 2023. PMID: 37715154 Free PMC article.
-
PYCR1 regulates glutamine metabolism to construct an immunosuppressive microenvironment for the progression of clear cell renal cell carcinoma.Am J Cancer Res. 2022 Aug 15;12(8):3780-3798. eCollection 2022. Am J Cancer Res. 2022. PMID: 36119844 Free PMC article.
-
Constructing and validating a risk model based on neutrophil-related genes for evaluating prognosis and guiding immunotherapy in colon cancer.J Gene Med. 2024 Apr;26(4):e3684. doi: 10.1002/jgm.3684. J Gene Med. 2024. PMID: 38618694 Review.
-
Neutrophil extracellular traps in tumor progression and immunotherapy.Front Immunol. 2023 Mar 13;14:1135086. doi: 10.3389/fimmu.2023.1135086. eCollection 2023. Front Immunol. 2023. PMID: 36993957 Free PMC article. Review.
Cited by
-
Prognostic value of neutrophil extracellular trap signature in clear cell renal cell carcinoma.Front Oncol. 2023 Jul 13;13:1205713. doi: 10.3389/fonc.2023.1205713. eCollection 2023. Front Oncol. 2023. PMID: 37519809 Free PMC article.
-
The Predictive Value of Neutrophil Extracellular Trap-Related Risk Score in Prognosis and Immune Microenvironment of Colorectal Cancer Patients.Mol Biotechnol. 2025 Apr;67(4):1509-1525. doi: 10.1007/s12033-024-01135-4. Epub 2024 Apr 5. Mol Biotechnol. 2025. PMID: 38580851
-
NETs-related genes predict prognosis and are correlated with the immune microenvironment in osteosarcoma.Front Oncol. 2025 Apr 10;15:1551074. doi: 10.3389/fonc.2025.1551074. eCollection 2025. Front Oncol. 2025. PMID: 40276062 Free PMC article.
-
Neutrophil extracellular traps in homeostasis and disease.Signal Transduct Target Ther. 2024 Sep 20;9(1):235. doi: 10.1038/s41392-024-01933-x. Signal Transduct Target Ther. 2024. PMID: 39300084 Free PMC article. Review.
-
Genes Selectively Expressed in Rat Organs.Curr Genomics. 2024;25(4):261-297. doi: 10.2174/0113892029273121240401060228. Epub 2024 Apr 8. Curr Genomics. 2024. PMID: 39156728 Free PMC article.
References
LinkOut - more resources
Full Text Sources