

Role of cuproptosis-related gene in lung adenocarcinoma
- PMID: 36620594
- PMCID: PMC9811388
- DOI: 10.3389/fonc.2022.1080985
Role of cuproptosis-related gene in lung adenocarcinoma
Abstract
Backgrounds: Lung adenocarcinoma (LUAD) is the most common subtype of lung cancer, which is the leading cause of cancer death. Dysregulation of cell proliferation and death plays a crucial role in the development of LUAD. As of recently, the role of a new form of cell death, cuproptosis, and it has attracted more and more attention. As of yet, it is not clear whether cuproptosis is involved in the progression of LUAD.
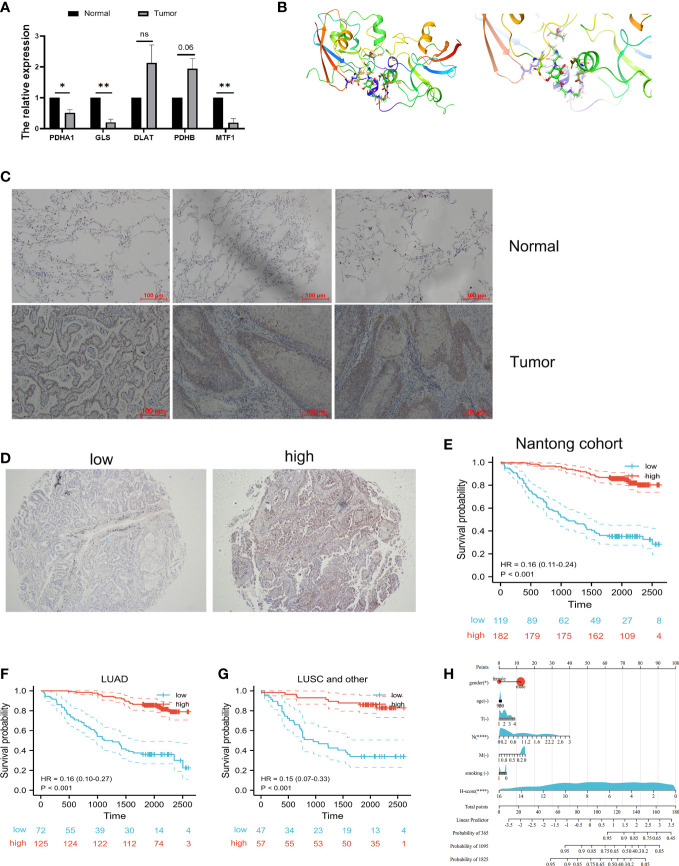
Methods: An integrated set of bioinformatics tools was utilized to analyze the expression and prognostic significance of cuproptosis-related genes. Meanwhile, a robust risk signature was developed using machine learning based on prognostic cuproptosis-related genes and explored the value of prognostic cuproptosis-related signature for clinical applications, functional enrichment and immune landscape. Lastly, the dysregulation of the cuproptosis-related genes in LUAD was validated by in vitro experiment.
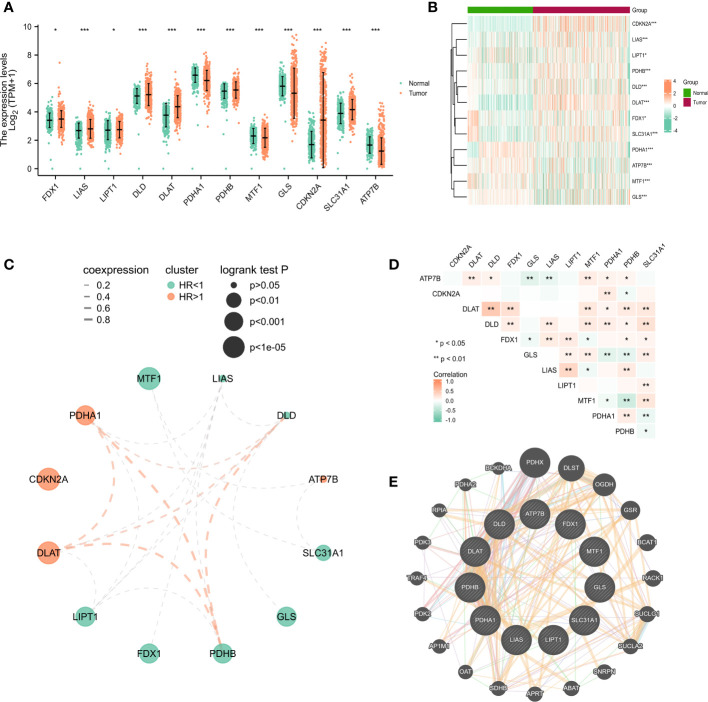
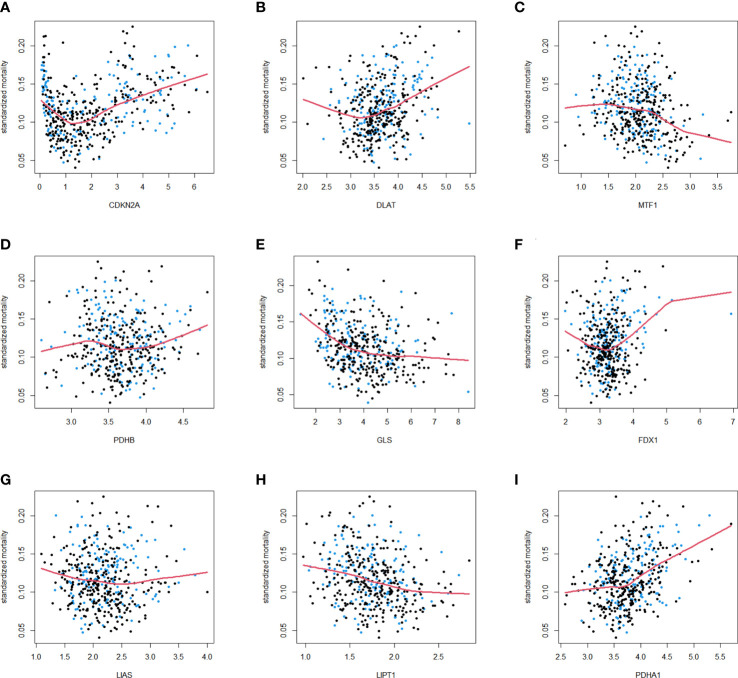
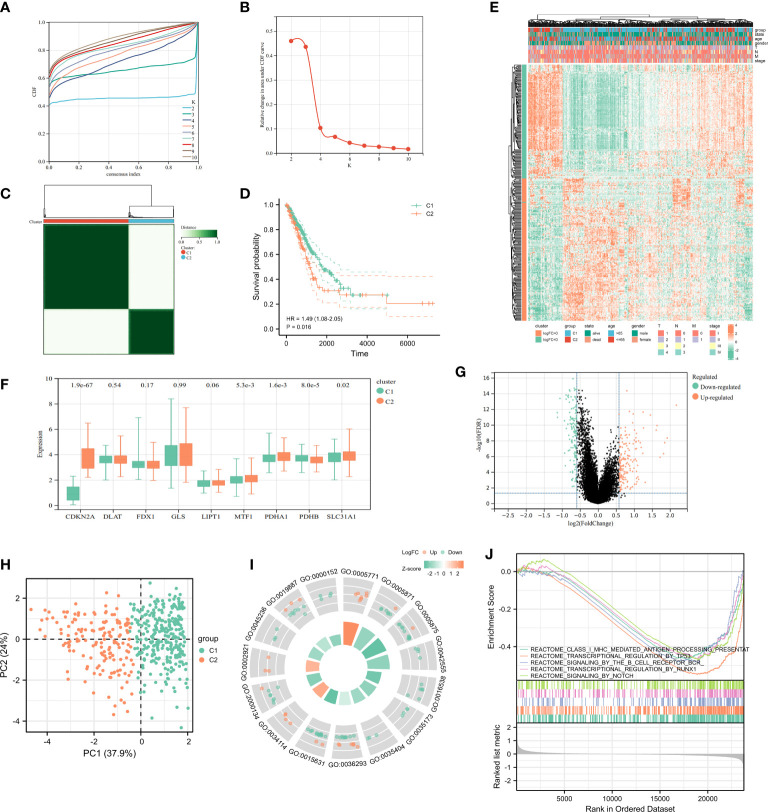
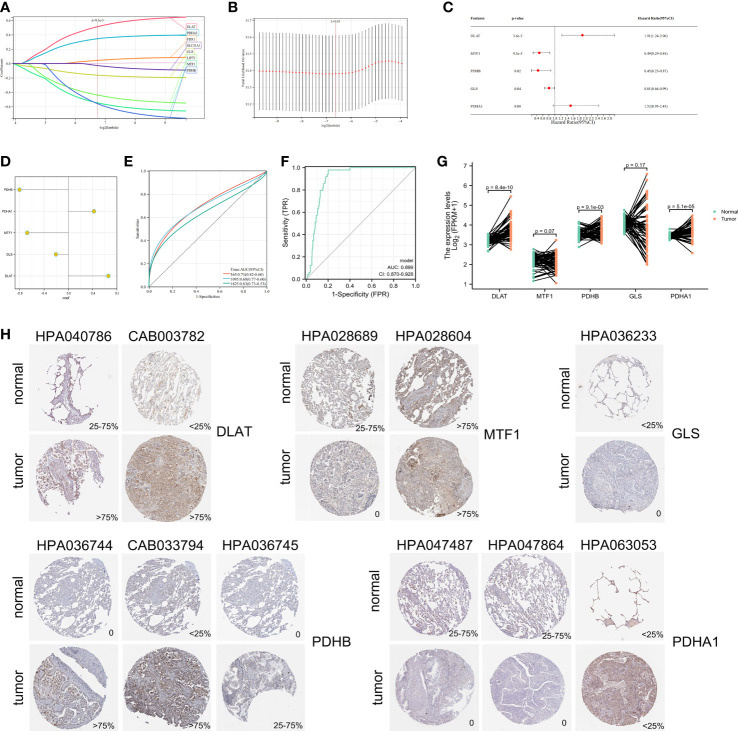
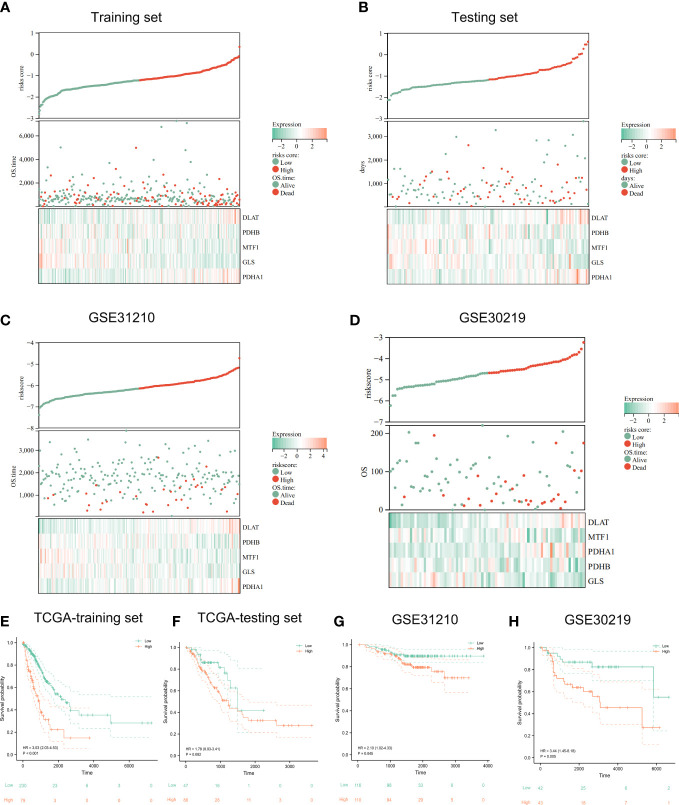
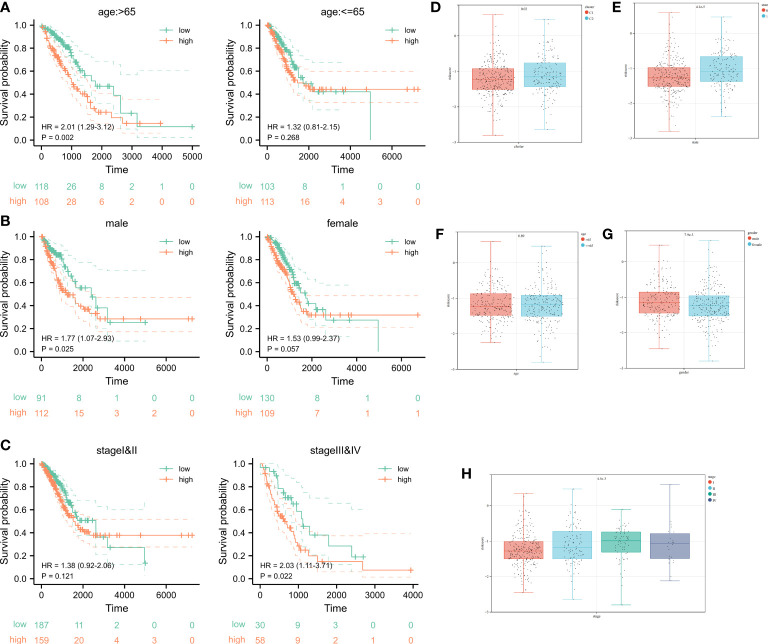
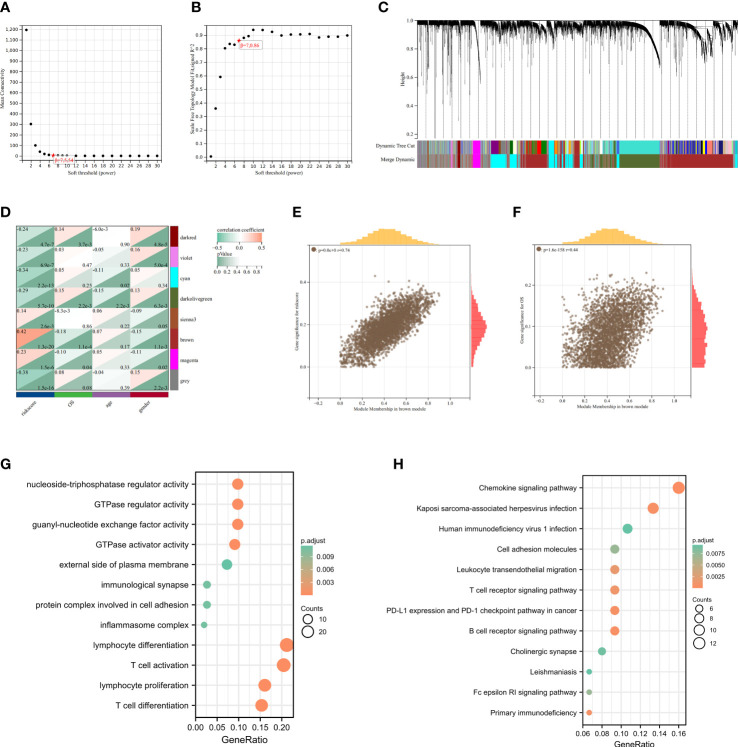
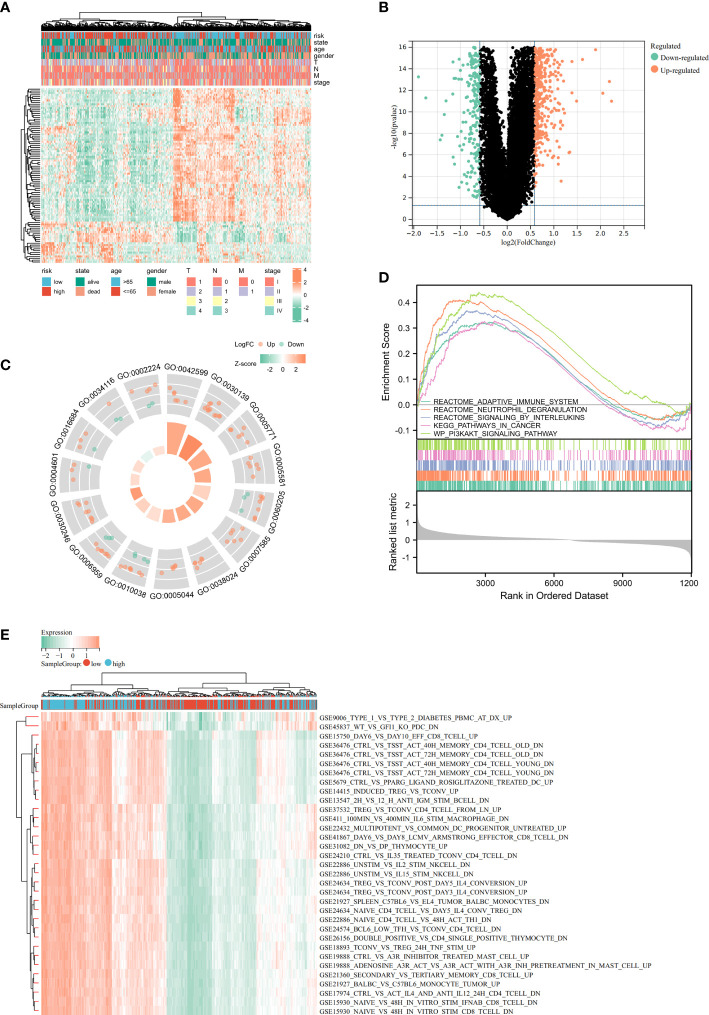
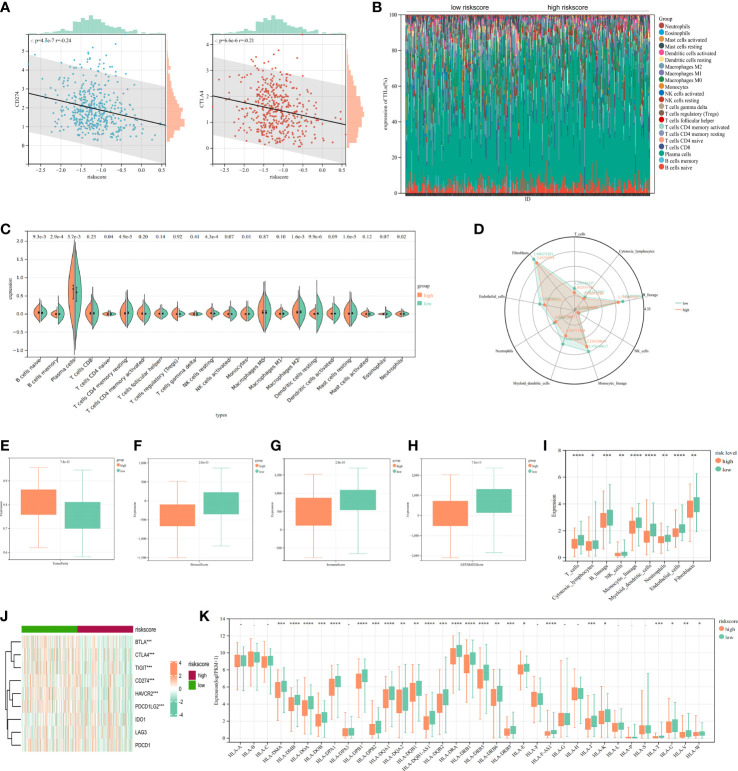
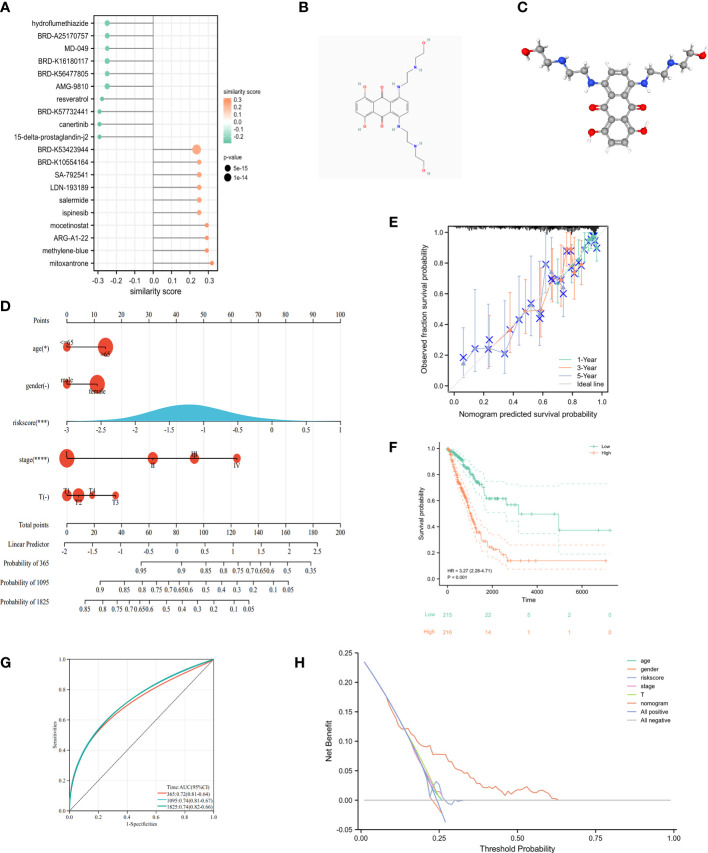
Results: In this study, first, cuproptosis-related genes were found to be differentially expressed in LUAD patients of public databases, and nine of them had prognostic value. Next, a cuproptosis-related model with five features (DLTA, MTF1, GLS, PDHB and PDHA1) was constructed to separate the patients into high- and low-risk groups based on median risk score. Internal validation set and external validation set were used for model validation and evaluation. What's more, Enrichment analysis of differential genes and the WGCNA identified that cuproptosis-related signatures affected tumor prognosis by influencing tumor immunity. Small molecule compounds were predicted based on differential expressed genes to improve poor prognosis in the high-risk group and a nomogram was constructed to further advance clinical applications. In closing, our data showed that FDX1 affected the prognosis of lung cancer by altering the expression of cuproptosis-related signature.
Conclusion: A new cuproptosis-related signature for survival prediction was constructed and validated by machine learning algorithm and in vitro experiments to reflect tumor immune infiltration in LUAD patients. The purpose of this article was to provide a potential diagnostic and therapeutic strategy for LUAD.
Keywords: cuproptosis; immune infiltration; immune microenvironment; lung adenocarcinoma; prognostic signature.
Copyright © 2022 Liu, Lin, Yang, Shao, Zhao, Wang and Shen.
Conflict of interest statement
The authors declare that the research was conducted in the absence of any commercial or financial relationships that could be construed as a potential conflict of interest.
Figures
Similar articles
-
Identification and validation of a novel cuproptosis-related stemness signature to predict prognosis and immune landscape in lung adenocarcinoma by integrating single-cell and bulk RNA-sequencing.Front Immunol. 2023 May 23;14:1174762. doi: 10.3389/fimmu.2023.1174762. eCollection 2023. Front Immunol. 2023. PMID: 37287976 Free PMC article.
-
A cuproptosis-related long non-coding RNA signature to predict the prognosis and immune microenvironment characterization for lung adenocarcinoma.Transl Lung Cancer Res. 2022 Oct;11(10):2079-2093. doi: 10.21037/tlcr-22-660. Transl Lung Cancer Res. 2022. PMID: 36386454 Free PMC article.
-
Identification of two molecular subtypes and a novel prognostic model of lung adenocarcinoma based on a cuproptosis-associated gene signature.Front Genet. 2023 Jan 12;13:1039983. doi: 10.3389/fgene.2022.1039983. eCollection 2022. Front Genet. 2023. PMID: 36712848 Free PMC article.
-
A novel prognostic signature for lung adenocarcinoma based on cuproptosis-related lncRNAs: A Review.Medicine (Baltimore). 2022 Dec 9;101(49):e31924. doi: 10.1097/MD.0000000000031924. Medicine (Baltimore). 2022. PMID: 36626411 Free PMC article. Review.
-
Machine learning algorithm to construct cuproptosis- and immune-related prognosis prediction model for colon cancer.World J Gastrointest Oncol. 2023 Mar 15;15(3):372-388. doi: 10.4251/wjgo.v15.i3.372. World J Gastrointest Oncol. 2023. PMID: 37009317 Free PMC article. Review.
Cited by
-
MTF1 genetic variants are associated with lung cancer risk in the Chinese Han population.BMC Cancer. 2024 Jun 28;24(1):778. doi: 10.1186/s12885-024-12516-y. BMC Cancer. 2024. PMID: 38943058 Free PMC article.
-
GLIPR2: a potential biomarker and therapeutic target unveiled - Insights from extensive pan-cancer analyses, with a spotlight on lung adenocarcinoma.Front Immunol. 2024 Feb 26;15:1280525. doi: 10.3389/fimmu.2024.1280525. eCollection 2024. Front Immunol. 2024. PMID: 38476239 Free PMC article.
-
Identification of a Novel Cuproptosis-Related Gene Signature and Integrative Analyses in Thyroid Cancer.J Clin Med. 2023 Mar 3;12(5):2014. doi: 10.3390/jcm12052014. J Clin Med. 2023. PMID: 36902801 Free PMC article.
-
Analysis of cuproptosis-related genes in prognosis and immune infiltration in grade 4 diffuse gliomas.Heliyon. 2024 Apr 9;10(7):e29212. doi: 10.1016/j.heliyon.2024.e29212. eCollection 2024 Apr 15. Heliyon. 2024. PMID: 38633656 Free PMC article.
-
Dysregulation of SIGLEC1 in non-small cell lung cancer: prognostic implications and immunomodulatory role-a multicenter cohort study.J Cancer Res Clin Oncol. 2024 Oct 29;150(10):481. doi: 10.1007/s00432-024-06005-9. J Cancer Res Clin Oncol. 2024. PMID: 39470815 Free PMC article.
References
-
- Lin JJ, Chin E, Yeap BY, Ferris LA, Kamesan V, Lennes IT, et al. . Increased hepatotoxicity associated with sequential immune checkpoint inhibitor and crizotinib therapy in patients with non-small cell lung cancer. J Thorac Oncol (2019) 14:135–40. doi: 10.1016/j.jtho.2018.09.001 - DOI - PMC - PubMed
LinkOut - more resources
Full Text Sources
Research Materials
Miscellaneous