. 2023 Feb 22;51(3):1364-1374.
doi: 10.1093/nar/gkac1242.

Graded impact of obstacle size on scanning by RNase E

Affiliations

Graded impact of obstacle size on scanning by RNase E

Jamie Richards et al. Nucleic Acids Res. .

Abstract

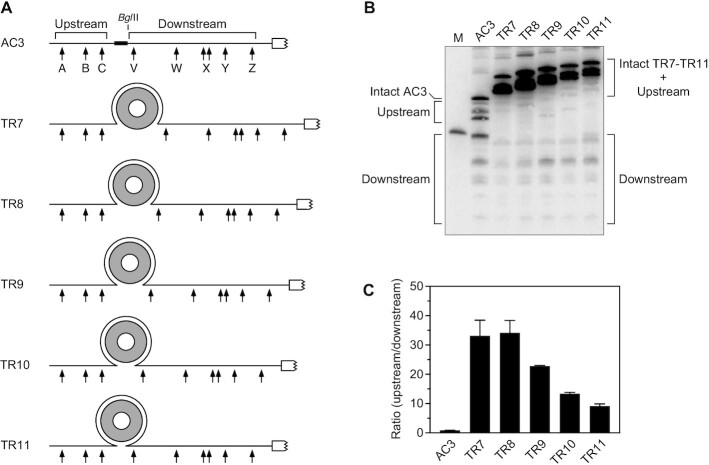
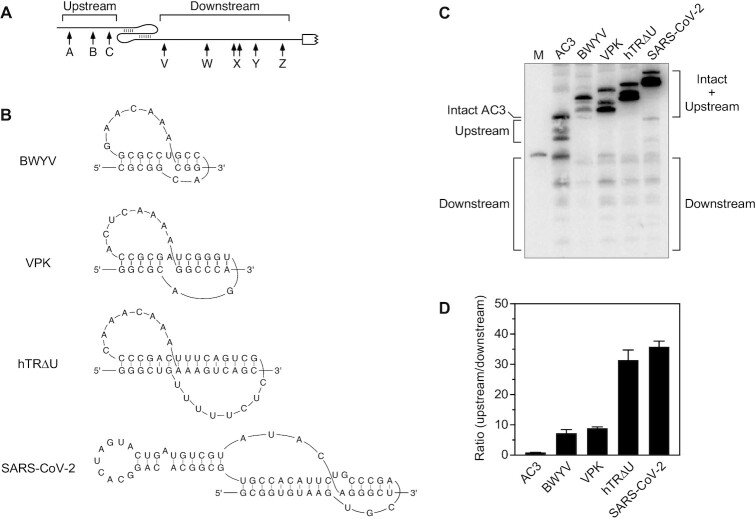
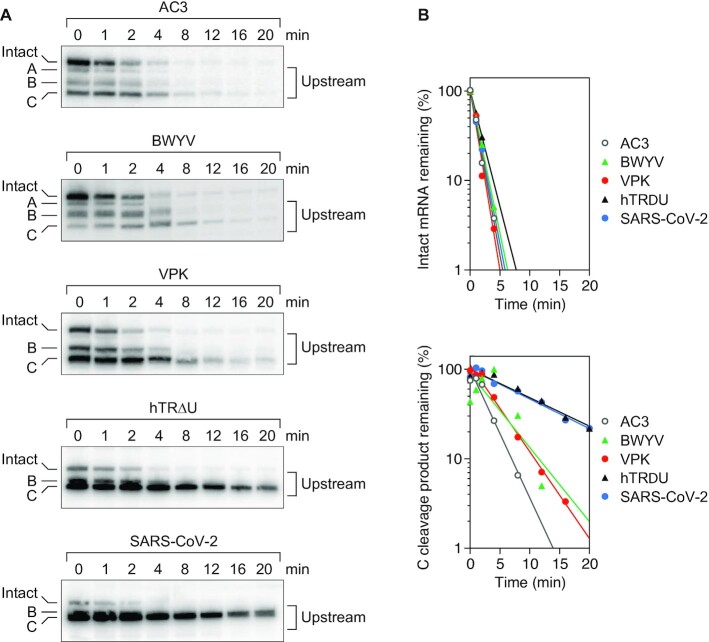
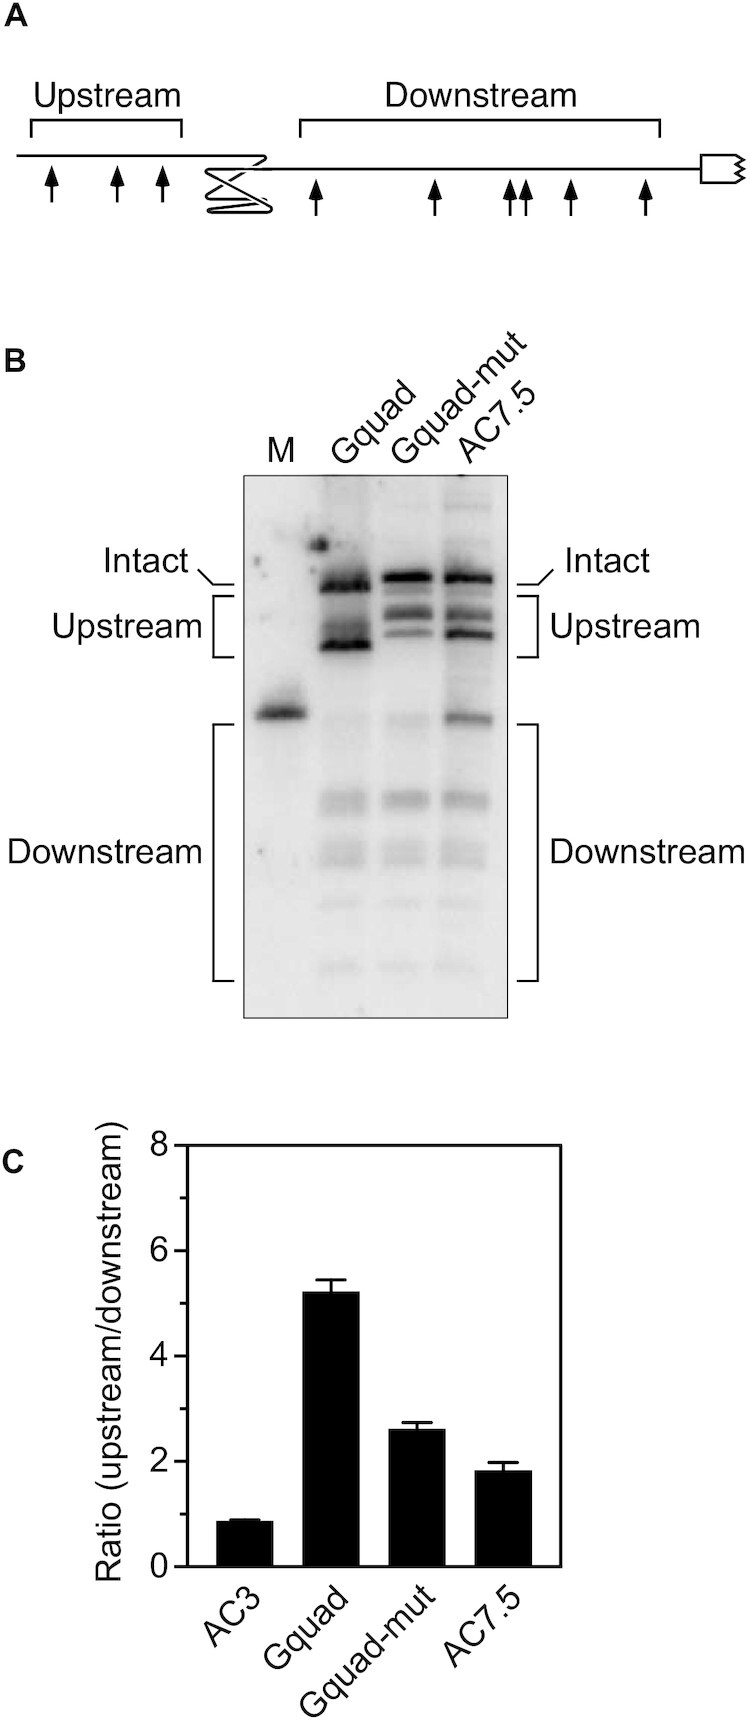
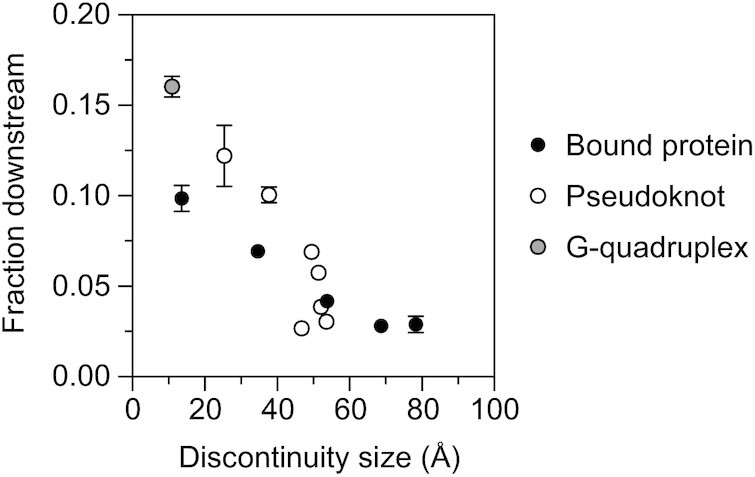
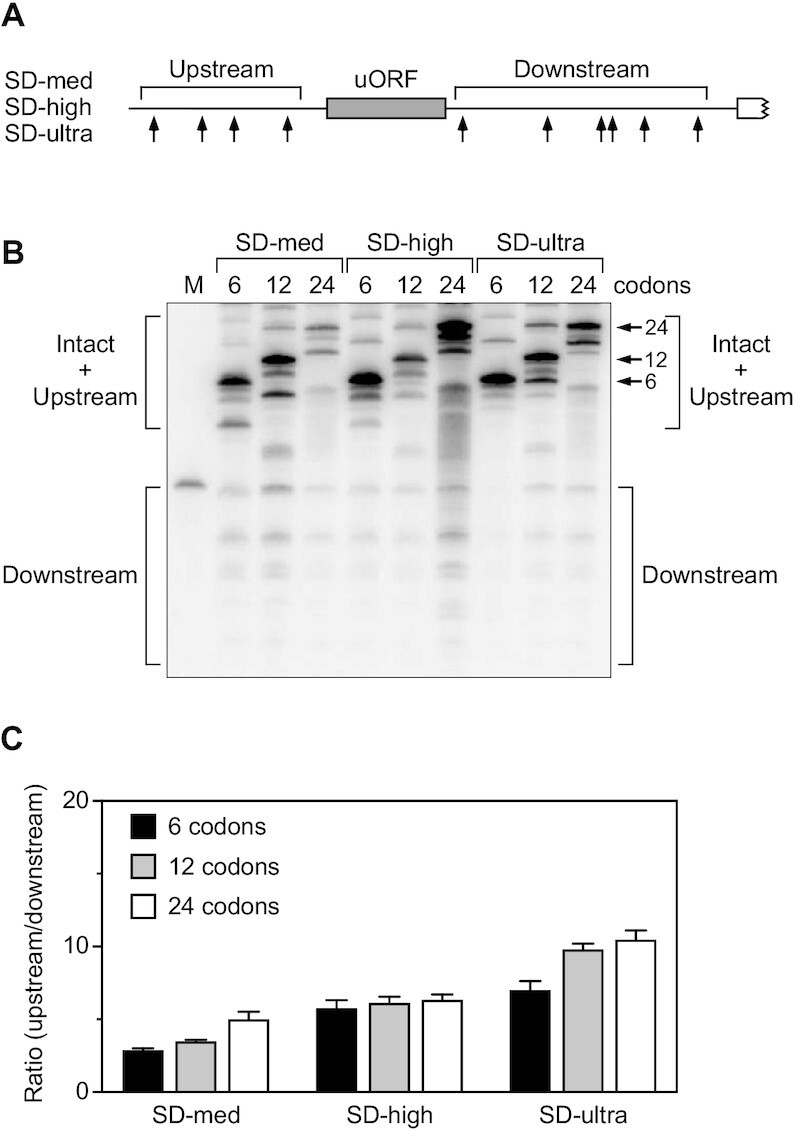
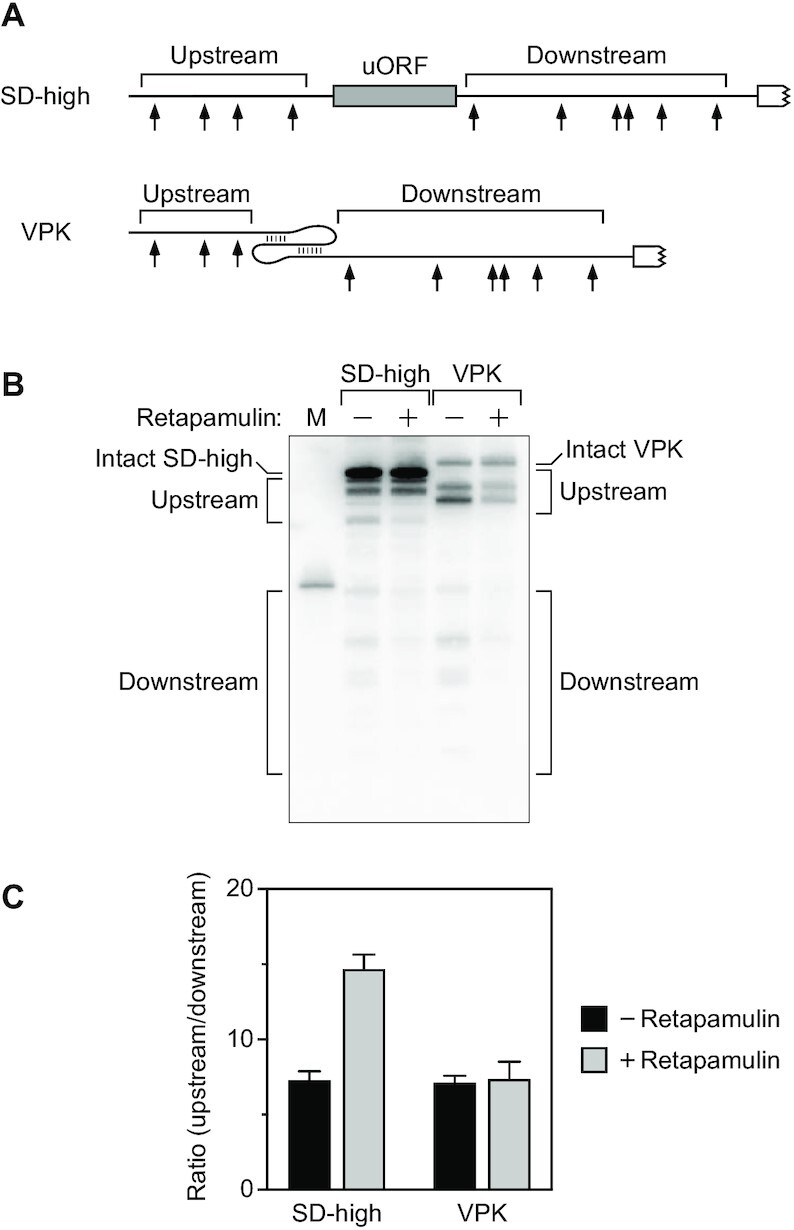
In countless bacterial species, the lifetimes of most mRNAs are controlled by the regulatory endonuclease RNase E, which preferentially degrades RNAs bearing a 5' monophosphate and locates cleavage sites within them by scanning linearly from the 5' terminus along single-stranded regions. Consequently, its rate of cleavage at distal sites is governed by any obstacles that it may encounter along the way, such as bound proteins or ribosomes or base pairing that is coaxial with the path traversed by this enzyme. Here, we report that the protection afforded by such obstacles is dependent on the size and persistence of the structural discontinuities they create, whereas the molecular composition of obstacles to scanning is of comparatively little consequence. Over a broad range of sizes, incrementally larger discontinuities are incrementally more protective, with corresponding effects on mRNA stability. The graded impact of such obstacles suggests possible explanations for why their effect on scanning is not an all-or-none phenomenon dependent simply on whether the size of the resulting discontinuity exceeds the step length of RNase E.


Figures

Figure 1.
Figure 1.
Protective effect of discontinuities created by TRAP binding. (A) 5′ UTR of reporter mRNAs containing a TRAP-binding site. Arrows, RNase E cleavage sites; gray ring, TRAP 11-mer; white rectangle with a jagged edge, beginning of the protein coding region; broad black line, (AC)3 spacer. (B) Cleavage within the 5′ UTR of reporter mRNAs containing a TRAP-binding site. Isogenic strains of E. coli containing each reporter mRNA and TRAP were grown to mid-log phase in the presence of tryptophan. Total RNA was extracted, and equal amounts were analyzed by northern blotting to detect cleavage within the 5′ UTR. The blot was probed with a radiolabeled oligonucleotide complementary to the coding region. M, boundary marker between the upstream and downstream cleavage sites. (C) Relative abundance of 5′ UTR cleavage products. The sum of the intensities of the bands in panel (B) resulting from cleavage upstream of the TRAP-binding site or (AC)3 spacer (A + B + C) was divided by the corresponding sum for 5′ UTR cleavage downstream (V + W + X + Y + Z). Each value is the average of three biological replicates. Error bars correspond to standard deviations.
Figure 2.
Figure 2.
Protective effect of discontinuities created by pseudoknots. (A) 5′ UTR of reporter mRNAs containing a pseudoknot. Arrows, RNase E cleavage sites; white rectangle with a jagged edge, beginning of the protein coding region. (B) Secondary structure of the BWYV, VPK, hTRΔU and SARS-CoV-2 pseudoknots (25–27,32). (C) Cleavage within the 5′ UTR of reporter mRNAs containing a pseudoknot between the upstream and downstream cleavage sites. Equal amounts of total cellular RNA from isogenic strains of E. coli containing each reporter mRNA were analyzed by northern blotting to detect cleavage within the 5′ UTR. The blot was probed with a radiolabeled oligonucleotide complementary to the coding region. M, boundary marker between the upstream and downstream cleavage sites. (D) Relative abundance of 5′ UTR cleavage products. The sum of the intensities of the bands in panel (C) resulting from cleavage upstream of the pseudoknot or (AC)3 spacer was divided by the corresponding sum for 5′ UTR cleavage downstream. Each value is the average of three biological replicates. Error bars correspond to standard deviations.
Figure 3.
Figure 3.
Effect of pseudoknots on the decay rates of reporter mRNAs and their upstream cleavage products. (A) Northern blots. Transcription was arrested by adding rifampicin to E. coli cells that contained each reporter (AC3, BWYV, VPK, hTRΔU, or SARS-CoV-2), and equal amounts of total cellular RNA isolated at time intervals thereafter were examined by northern blotting. Only bands representing the intact transcript and upstream cleavage products (A, B and C) are shown. (B) Graphs. The remaining percentage of the intact transcript (top) and cleavage product C (bottom) was plotted semilogarithmically for each reporter as a function of time after blocking further RNA synthesis. Representative experiments are shown.
Figure 4.
Figure 4.
Effect of extending the VPK pseudoknot. (A) Pseudoknot secondary structures. In VPK+2, VPK+3 and VPK+4, two, three, or four base pairs, respectively, were added to the VPK pseudoknot, together with two, three, or four unpaired loop nucleotides. In VPK-AC2, four unpaired nucleotides (ACAC) were added immediately downstream of an unmodified VPK pseudoknot. (B) Cleavage within the 5′ UTR of reporter mRNAs containing a pseudoknot between the upstream and downstream sites. Equal amounts of total cellular RNA from isogenic strains of E. coli containing each reporter mRNA were analyzed by northern blotting to detect cleavage within the 5′ UTR. The blot was probed with a radiolabeled oligonucleotide complementary to the coding region. M, boundary marker between the upstream and downstream cleavage sites. (C) Relative abundance of 5′ UTR cleavage products. The sum of the intensities of the bands in panel (B) resulting from cleavage upstream of the pseudoknot was divided by the corresponding sum for 5′ UTR cleavage downstream. Each value is the average of three biological replicates. Error bars correspond to standard deviations. (D) Decay rates of reporter mRNAs and their upstream cleavage products. (Left) Transcription was arrested by adding rifampicin to E. coli cells that contained VPK, VPK+4 or VPK-AC2 mRNA, and equal amounts of total cellular RNA isolated at time intervals thereafter were examined by northern blotting. Only bands representing the intact transcript and upstream cleavage products (A, B and C) are shown. (Right) The remaining percentage of the intact transcript (top) and cleavage product C (bottom) was plotted semilogarithmically as a function of time after blocking further RNA synthesis. Representative experiments are shown.
Figure 5.
Figure 5.
Protective effect of a G-quadruplex. (A) 5′ UTR of a reporter mRNA containing a G-quadruplex. Arrows, RNase E cleavage sites; white rectangle with a jagged edge, beginning of the protein coding region. (B) Cleavage within the 5′ UTR of reporter mRNAs containing a G-quadruplex (Gquad: GGGUGGGUGGGUGGG) or either of two other pentadecanucleotides (Gquad-mut: CGGUGCGUGGCUCGG; AC7.5: ACACACACACACACA) between the upstream and downstream sites. Equal amounts of total cellular RNA from isogenic strains of E. coli containing each reporter mRNA were analyzed by northern blotting to detect cleavage within the 5′ UTR. The blot was probed with a radiolabeled oligonucleotide complementary to the coding region. M, boundary marker between the upstream and downstream cleavage sites. (C) Relative abundance of 5′ UTR cleavage products. The sum of the intensities of the bands in panel (B) resulting from cleavage upstream of the G-quadruplex, pentadecanucleotide, or (AC)3 spacer was divided by the corresponding sum for 5′ UTR cleavage downstream. Each value is the average of three biological replicates. Error bars correspond to standard deviations.
Figure 6.
Figure 6.
Correlation between the size and protective effect of discontinuities. The fraction of 5′ UTR cleavage products cut downstream of various protein (black circle) and RNA (white or gray circle) obstacles (1/[R+ 1], where R is the ratio of upstream versus downstream cleavage products graphed in Figures 1-2 and 4-5) was plotted as a function of the size of the discontinuity that they each create, as estimated from empirically determined structures (23,25–27,31,32) and predicted structures generated by using an ideal RNA double helix and PyMOL to model the extensions in VPK+2, VPK+3 and VPK+4. Each value is the average of three independent measurements. Error bars (not always visible) correspond to standard deviations.
Figure 7.
Figure 7.
Effect of uORF length. (A) 5′ UTR of reporter mRNAs containing a uORF (SD-med, SD-high, or SD-ultra). Arrows, cleavage sites; gray rectangle, uORF; white rectangle with a jagged edge, beginning of the principal open reading frame. (B) Cleavage within the 5′ UTR of reporter mRNAs containing a 6-, 12- or 24-codon uORF preceded by any of three Shine-Dalgarno elements (SD-med = AGGA, SD-high = AGGAG or SD-ultra = UAAGGAGG) between the upstream and downstream sites. Equal amounts of total cellular RNA from isogenic strains of E. coli containing each reporter mRNA were analyzed by northern blotting to detect cleavage within the 5′ UTR. The blot was probed with a radiolabeled oligonucleotide complementary to the principal open reading frame. Arrows identify bands corresponding to the intact transcripts. M, boundary marker between the upstream and downstream cleavage sites. Faint bands between the upstream and downstream regions resulted from infrequent cleavage within the uORF. (C) Relative abundance of 5′ UTR cleavage products. The sum of the intensities of the bands in panel (B) resulting from cleavage upstream of the uORF was divided by the corresponding sum for 5′ UTR cleavage downstream. Each value is the average of three biological replicates. Error bars correspond to standard deviations.
Figure 8.
Figure 8.
Effect of retapamulin. (A) 5′ UTR of reporter mRNAs containing a uORF (SD-high with six codons) or a VPK pseudoknot. Arrows, cleavage sites; gray rectangle, uORF; white rectangle with a jagged edge, beginning of the principal open reading frame. (B) Cleavage within the 5′ UTR of the reporter mRNAs illustrated in panel (A). Total RNA was extracted from isogenic strains of E. coli containing each reporter before or 5 min after treating the cells with retapamulin, and equal amounts of RNA were analyzed by northern blotting to detect cleavage within the 5′ UTR. M, boundary marker between the upstream and downstream cleavage sites. (C) Relative abundance of 5′ UTR cleavage products. The sum of the intensities of the bands in panel (B) resulting from cleavage upstream of the obstacle was divided by the corresponding sum for 5′ UTR cleavage downstream. Each value is the average of three biological replicates. Error bars correspond to standard deviations.

Similar articles

Cited by

References

    1. Mackie G.A. RNase E: at the interface of bacterial RNA processing and decay. Nat. Rev. Microbiol. 2013; 11:45–57. - PubMed
    1. McDowall K.J., Lin-Chao S., Cohen S.N.. A+U content rather than a particular nucleotide order determines the specificity of RNase E cleavage. J. Biol. Chem. 1994; 269:10790–10796. - PubMed
    1. Lin-Chao S., Wong T.-T., McDowall K.J., Cohen S.N.. Effects of nucleotide sequence on the specificity of rne-dependent and RNase E-mediated cleavages of RNA I encoded by the pBR322 plasmid. J. Biol. Chem. 1994; 269:10797–10803. - PubMed
    1. Kaberdin V.R. Probing the substrate specificity of Escherichia coli RNase E using a novel oligonucleotide-based assay. Nucleic Acids Res. 2003; 31:4710–4716. - PMC - PubMed
    1. Del Campo C., Bartholomäus A., Fedyunin I., Ignatova Z.. Secondary structure across the bacterial transcriptome reveals versatile roles in mRNA regulation and function. PLoS Genet. 2015; 11:e1005613. - PMC - PubMed

Publication types