. 2023 Feb:36:100872.
doi: 10.1016/j.neo.2022.100872. Epub 2023 Jan 6.

Subclonal evolution and expansion of spatially distinct THY1-positive cells is associated with recurrence in glioblastoma

Affiliations

Subclonal evolution and expansion of spatially distinct THY1-positive cells is associated with recurrence in glioblastoma

Wajd N Al-Holou et al. Neoplasia. 2023 Feb.

Abstract

Purpose: Glioblastoma(GBM) is a lethal disease characterized by inevitable recurrence. Here we investigate the molecular pathways mediating resistance, with the goal of identifying novel therapeutic opportunities.

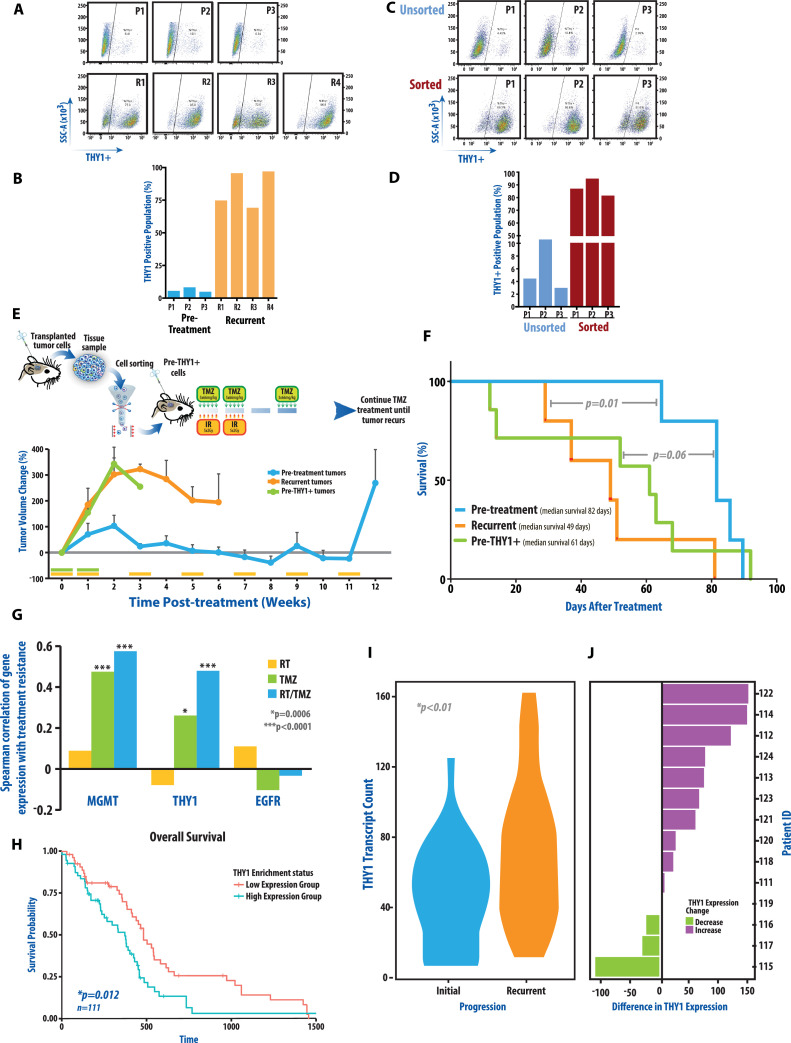
Experimental design: We developed a longitudinal in vivo recurrence model utilizing patient-derived explants to produce paired specimens(pre- and post-recurrence) following temozolomide(TMZ) and radiation(IR). These specimens were evaluated for treatment response and to identify gene expression pathways driving treatment resistance. Findings were clinically validated using spatial transcriptomics of human GBMs.

Results: These studies reveal in replicate cohorts, a gene expression profile characterized by upregulation of mesenchymal and stem-like genes at recurrence. Analyses of clinical databases revealed significant association of this transcriptional profile with worse overall survival and upregulation at recurrence. Notably, gene expression analyses identified upregulation of TGFβ signaling, and more than one-hundred-fold increase in THY1 levels at recurrence. Furthermore, THY1-positive cells represented <10% of cells in treatment-naïve tumors, compared to 75-96% in recurrent tumors. We then isolated THY1-positive cells from treatment-naïve patient samples and determined that they were inherently resistant to chemoradiation in orthotopic models. Additionally, using image-guided biopsies from treatment-naïve human GBM, we conducted spatial transcriptomic analyses. This revealed rare THY1+ regions characterized by mesenchymal/stem-like gene expression, analogous to our recurrent mouse model, which co-localized with macrophages within the perivascular niche. We then inhibited TGFBRI activity in vivo which decreased mesenchymal/stem-like protein levels, including THY1, and restored sensitivity to TMZ/IR in recurrent tumors.

Conclusions: These findings reveal that GBM recurrence may result from tumor repopulation by pre-existing, therapy-resistant, THY1-positive, mesenchymal cells within the perivascular niche.

Keywords: Glioblastoma; Subclonal evolution; Treatment resistance.


Conflict of interest statement

Declaration of Competing Interest The authors declare that they have no known competing financial interests or personal relationships that could have appeared to influence the work reported in this paper.

Figures

Fig 1
Fig. 1
Analysis of longitudinal intracranial GBM samples, pre-treatment and at recurrence, reveals development of a therapeutic resistant phenotype. (A) Schematic of experimental design. Mice bearing intracranial tumors derived from human GBM explants are treated with concomitant temozolomide (TMZ) and radiation (IR) for two weeks followed by adjuvant TMZ until animals became moribund. Tumor biopsies are obtained pre-treatment and at recurrence to provide samples for molecular analysis and additional in vivo and in vitro comparative studies. (B) Representative MR images from Control, TMZ/IR and TMZ/IR+TMZ treatment groups at 0, 2, 7 and 13 weeks post-initiation. (C) Treatment response quantified using MR-imaging derived tumor volume changes in Control, TMZ/IR and TMZ/IR+TMZ intracranial tumor bearing groups. TMZ/IR treatment involved 2 weeks of concomitant TMZ/IR, while mice receiving TMZ/IR+TMZ received the initial 2 week treatment followed by maintenance adjuvant TMZ every other week. Percent change in tumor volume is shown as mean change in a cohort of five animals with SEM. (D) Pre-treatment(Pre-Tx) and post-treatment(recurrent) biopsy samples were re-implanted subcutaneously into the flanks of mice to evaluate their sensitivity to treatment as described in methods(Median volume +SEM shown). Pre-treatment and recurrent tumors show similar growth rates in the absence of treatment, while recurrent tumors exhibit an inherent resistance to TMZ/IR. (E) Samples described in D were also evaluated intracranially. Tumor volumes derived from pre-treatment and recurrent tumors with or without TMZ/IR are shown as mean tumor volumes (+SEM) as well as representative MR images three weeks after treatment initiation. (F) Kaplan-Meier survival curve of mice after intracranial implantation of pre-treatment and recurrent tumors with or without TMZ/IR treatment. Mice bearing recurrent tumors have significantly worse survival with treatment. Animal experiments were performed with 5 replicates.
Fig 2
Fig. 2
RNAseq analyses reveal a resistant gene expression profile that predicts outcomes in clinical datasets. (A) A diagrammatic representation of the experimental workflow. Paired pre-treatment and recurrent tumor samples are evaluated by next generation sequencing of RNA samples extracted from cells. (B) Unsupervised clustering analysis revealed that replicate independent pre-treatment samples clustered together had a similar gene expression pattern. Similarly independent replicate recurrent samples clustered together. Heatmap of differentially expressed genes in independent pre-treatment biopsies (P1,P2,P3) and recurrent tumor biopsies (R1,R2,R3,R4). (C) Functional clusters of upregulated and downregulated genes in recurrent tumors. Bar graph shows percentage of gene counts of each cluster compared to total upregulated or downregulated genes. P-value of each cluster is labeled next to each bar. Cell adhesion genes were upregulated in recurrent tumors. (D) Heatmap of individual genes within the highest upregulated clusters. Overall (E) and progress-free survival (F) of GBM patients with high and low expression levels of a signature characterized by cell adhesion genes, showing that this upregulated signature predicts outcomes in GBM patients(TCGA, Firehose Legacy microarray data).
Fig 3
Fig. 3
Analyses of paired samples reveals development of a therapeutic resistant phenotype with a mesenchymal gene expression pattern that is reversed with TGFβ inhibition. (A) Upregulated genes in recurrent samples (R1-R4) associated with a mesenchymal signature were confirmed by qRTPCR, show notable upregulation in recurrent samples compared to pre-treatment samples (P1-P3). THY1 is most prominently differentially upregulated, greater than 100-fold compared to pre-treatment levels. Analyses performed in triplicate. (B) Upregulated genes in recurrent samples associated with a stem cell phenotype were confirmed using qRTPCR. FACS analysis of CD133 expression in pre-treatment and recurrent neurosphere cells (bottom right panel) shows upregulation of CD133+ cells in 3 of 4 samples at recurrence. qRTPCR Analyses performed in triplicate with standard error bars shown. (C, D) Western blot analysis confirmed that the protein levels for each of these genes were also increased in the majority of recurrent samples compared to their untreated counterparts. (E) Analysis of paired clinical specimens (pre-treatment and recurrent) from the patient from which the PDX line was derived was performed (TCGA 06-0190) and showed upregulation at recurrence of many of the genes identified in the recurrent mouse model (* indicating genes of interest). (F) Western blot analysis shows that inhibition of TGFβ signaling results in a marked decrease in expression of proteins associated with a mesenchymal and stem cell signature in recurrent tumor samples. P2 (treatment naïve sample 2). R1 (recurrent sample 1), RT1-RT5 (recurrent samples treated as indicated in five independent animals) with TMZ/IR, LY2109761, or combination of TMZ/IR and LY2109761 as described below. (G) Animals bearing flank pre-treatment tumors as well as recurrent tumors were randomized into four groups: 1) An untreated group (control), 2) Treatment with TMZ (TMZ, 5 days/week at 66mg/kg) and IR (5 days/ week at 2Gy) for two weeks followed by TMZ (3 days/week at 66mg/kg) every other week (TMZ/IR), 3) Treatment with LY2109761 where mice received 50mg/kg LY2109761 twice every day, 5 days/week for the first two weeks followed by 3 days/week every other week (LY2109761), and 4) TMZ/IR/LY2109761 group where the animals were treated with a combination of the three aforementioned treatment modalities. 5 animal replicates were evaluated. Mean volume + SEM shown. p-values shown with *signifying p<0.05.
Fig 4
Fig. 4
Rare THY1+ cell populations are identified in the pre-treatment samples, are inherently treatment resistant, and repopulate the recurrent tumors. (A) THY1 cell positivity is highly upregulated in recurrent samples as seen by flow cytometry and representative bar graph (B). 6-10% of pre-treatment samples (P1-P3) demonstrate THY1-positivity while 72-96% of recurrent samples (R1-R4) reveal THY1-positivity(left) with quantification of replicate experiments shown(right). (C, D) THY1-positive cells were immuno-purified from P1, P2 and P3 samples by FACS. This sorted THY1+ cell population was cultured for expansion and re-tested to confirm stable THY1 cell surface staining. (E) Sorted THY1+ cell population from P2 (Pre-THY1+) was implanted intracranially to assess treatment response. Resistance to TMZ/IR was observed in the Pre-THY1+ tumor bearing animals that mirrored the phenotype observed in recurrent tumors, but distinct from pre-treatment samples. Mean tumor volume (E) (+SEM) and survival analysis by Kaplan-Meier (F) are shown. 5 animal replicates were evaluated. (G) RNAseq analysis of 31 orthotopic GBM PDXs treated with standard therapies were used to determine Spearmans correlation value as described in the text . Bar chart showing association of the indicated gene expression with treatment resistance. This analysis revealed that THY1, one of the most highly expressed genes in our recurrent samples, was associated with TMZ/IR resistance with a magnitude of correlation similar to MGMT. EGFR was used as a negative control. *indicates p-value=0.0006 and FDR=0.04 and ***indicates p-value<0.00001 and FDR below 0.0007. (H) Evaluation of RNAseq data from the TCGA (TCGA, Firehose Legacy) reveals THY1 expression is associated with significantly worse overall survival. (I) Analysis of longitudinal GBM specimens reveals significant upregulation of THY1 expression in recurrent tumors(GLASS consortium) with most patients showing increased expression (J).
Fig 5
Fig. 5
Induction of THY1 overexpression results in increased treatment resistance, whereas THY1 doxycycline-inducible knockout results in increased treatment sensitivity. U87 high grade glioma lines with baseline low THY1 expression were induced to overexpress THY1. (A) Flow cytometric analysis of U87 cells expressing either an empty vector or THY1 overexpression (THY1 OE). APC-conjugated control IgG is used as control. Percentages indicate THY1 membrane expression in indicated cells (B) Western blot analysis of U87 cells over-expressing THY1. Data shown represents analysis of indicated proteins separated on the same gel. (C) TMZ/IR dose response curves of U87 cells expressing either vector or THY1 OE with IC50 values shown. * indicates p-value of 0.05 using paired t-test analysis. (D) Western blots of lysates were obtained from the UM3506 organoid lines after 3 days of doxycycline treatment. Data shown represents analysis of indicated proteins on the same gel. (E) TMZ dose response curves of doxycycline-induced control sgRNA and sgRNA targeting THY1 in UM3506 organoid lines after 7 days. IC50 values shows. * indicates p-value<0.05 obtained after paired t-test to compare dose response curves with doxycycline treated non targeting sgNT line. Experiments were performed in duplicates and repeated at least two times. OE= Overexpression; NT = non-targeting.
Fig 6
Fig. 6
Spatial transcriptomic analysis (ST) of treatment-naive human GBM biopsies reveal that THY1 expression significantly co-localizes with a glioma stem cell (GSC), and epithelial to mesenchymal transition (EMT) gene expression signatures within the perivascular niche. (A) A schematic depicting the experimental approach for evaluating the spatial distribution of gene expression profiles within a GBM biopsy. (B) MRI from a patient with primary GBM showing T1-post contrast weighted MRI and corresponding perfusion (CBV) scan. Two image-guided stereotactic biopsies were acquired, one from a contrast-enhancing region with relative high-perfusion, and a second from an enhancing region with low-perfusion. (C,D) UMAP analyses depicting spatial regions with unique gene expression profiles within both samples. (E,F) ST analysis of a GBM biopsy from a region with high perfusion (E) and Low Perfusion (F). Spatial distribution of THY1 expression is shown along with vascular (VASC), GSC, and EMT pathway enrichment scores. The left panels show the spatial gene expression of each individual gene set. The middle panel shows 1 minus p-values from a spatially local Fisher's exact test within each spot for significant overlap between regions with high pathway enrichment scores and high THY1 expression. Significance in spatial overlap between the pathway enrichment scores and THY1 expression was tested by using a sliding window approach to perform spatially-local Fisher's test. On the right are scatterplots showing gene expression of THY1(x-axis) and enrichment scores for gene set of interest(y-axis) within each spatial location with line fitted. P-values show significance of correlation. THY1 significantly co-localizes with these gene sets both in the high and low perfusion samples. (G) Violin plots evaluating spatial co-localization of THY1 high regions and THY1 low regions with gene sets of interest. The plots are a composite of ST spots from 4 clinical GBM samples from 3 patients, and show that THY1 expression consistently co-localizes with vascular, GSC, EMT, macrophage, and TGFβ expression. Hypoxia shown as a negative comparison. p-values shown based on Student's t-test.

References

    1. Stupp R., et al. Effects of radiotherapy with concomitant and adjuvant temozolomide versus radiotherapy alone on survival in glioblastoma in a randomised phase III study: 5-year analysis of the EORTC-NCIC trial. Lancet Oncol. 2009;10(5):459–466. - PubMed
    1. Stupp R., et al. Radiotherapy plus concomitant and adjuvant temozolomide for glioblastoma. N. Engl. J. Med. 2005;352(10):987–996. - PubMed
    1. Hambardzumyan D., Bergers G. Glioblastoma: defining tumor niches. Trends Cancer. 2015;1(4):252–265. - PMC - PubMed
    1. Parker N.R., et al. Intratumoral heterogeneity identified at the epigenetic, genetic and transcriptional level in glioblastoma. Sci. Rep. 2016;6:22477. - PMC - PubMed
    1. Kim H., et al. Whole-genome and multisector exome sequencing of primary and post-treatment glioblastoma reveals patterns of tumor evolution. Genome Res. 2015;25(3):316–327. - PMC - PubMed

Publication types

Substances