

Baseline Sequencing Surveillance of Public Clinical Testing, Hospitals, and Community Wastewater Reveals Rapid Emergence of SARS-CoV-2 Omicron Variant of Concern in Arizona, USA
- PMID: 36622143
- PMCID: PMC9972916
- DOI: 10.1128/mbio.03101-22
Baseline Sequencing Surveillance of Public Clinical Testing, Hospitals, and Community Wastewater Reveals Rapid Emergence of SARS-CoV-2 Omicron Variant of Concern in Arizona, USA
Abstract
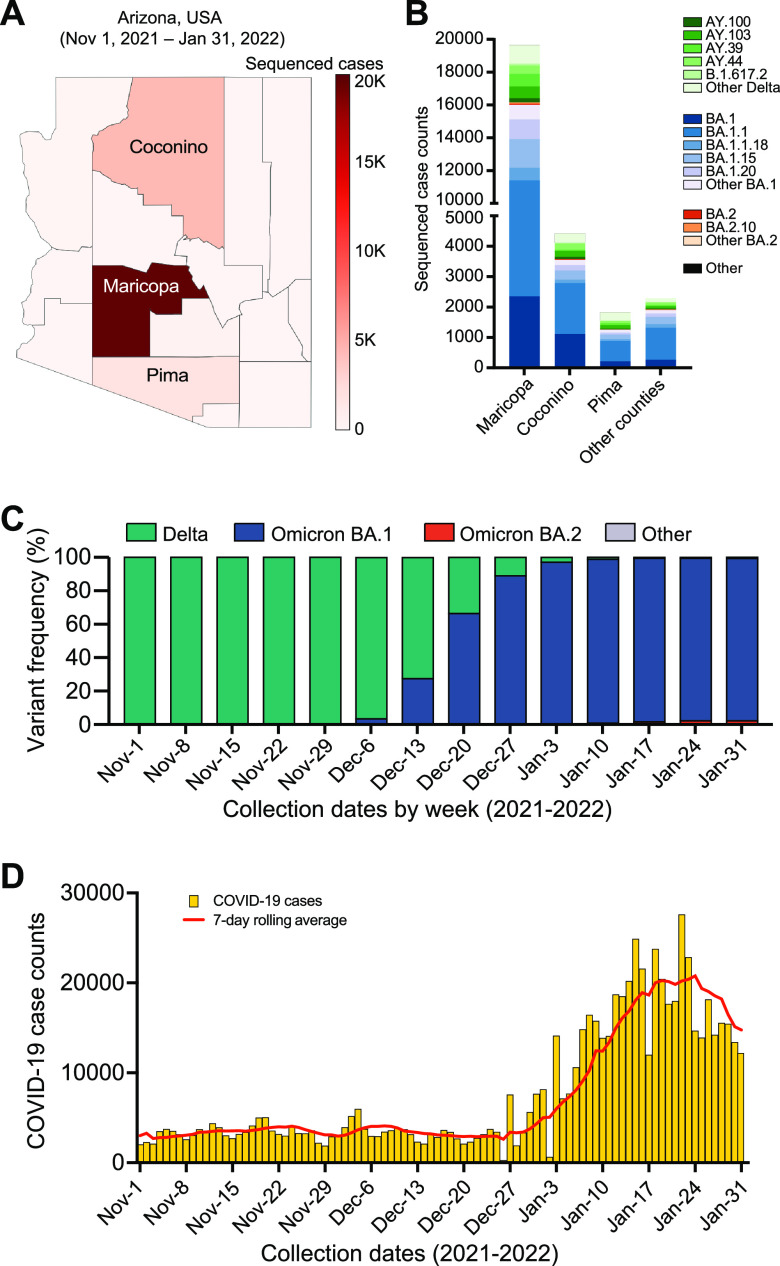
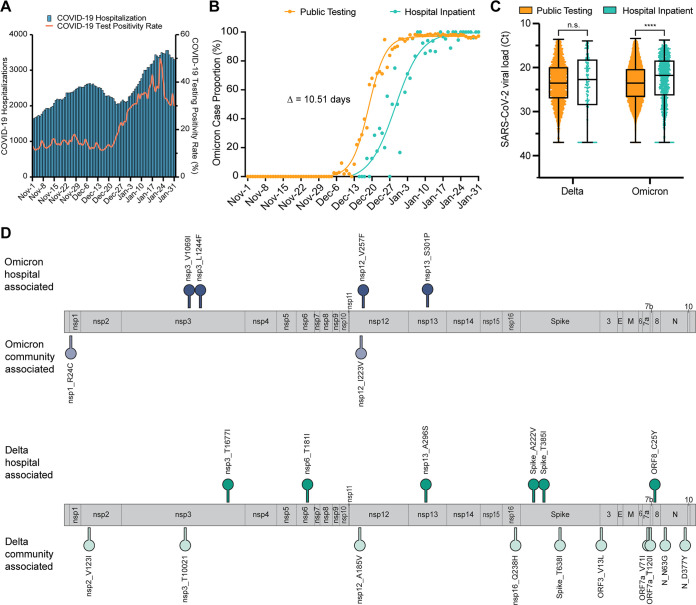
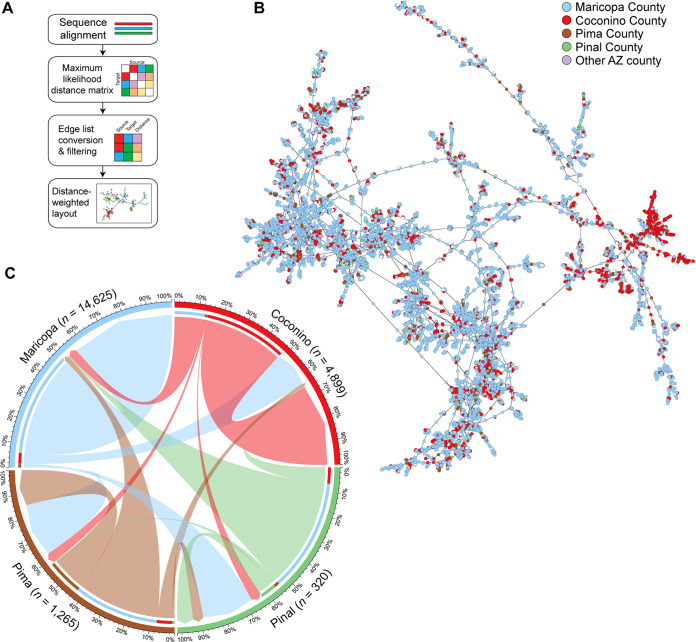
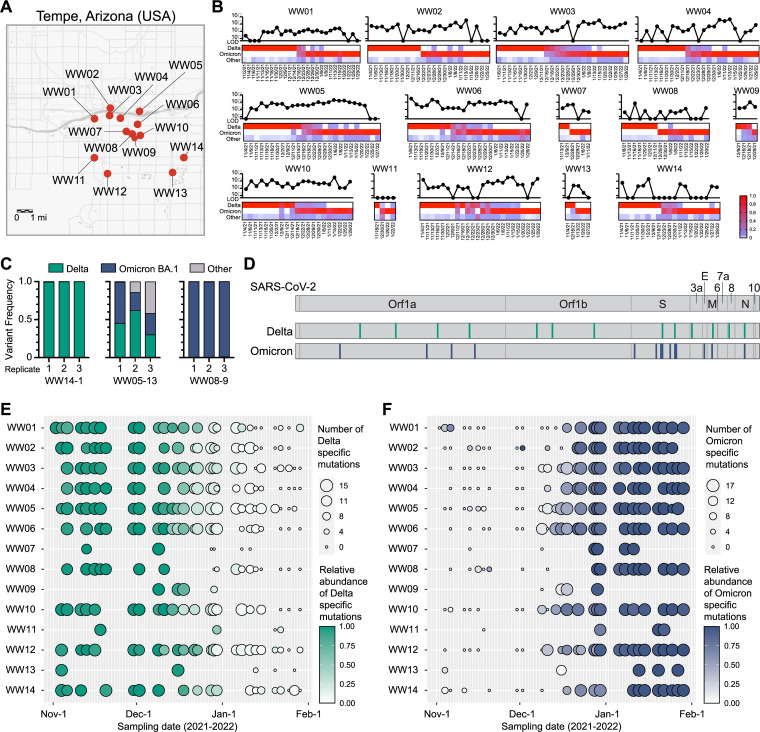
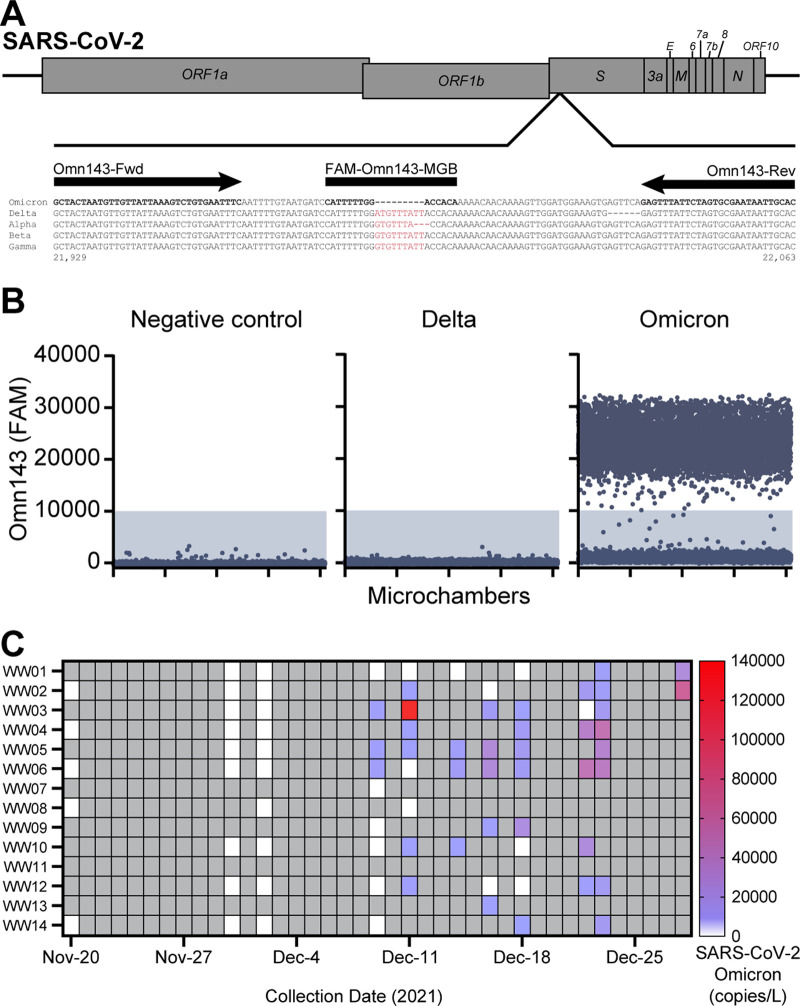
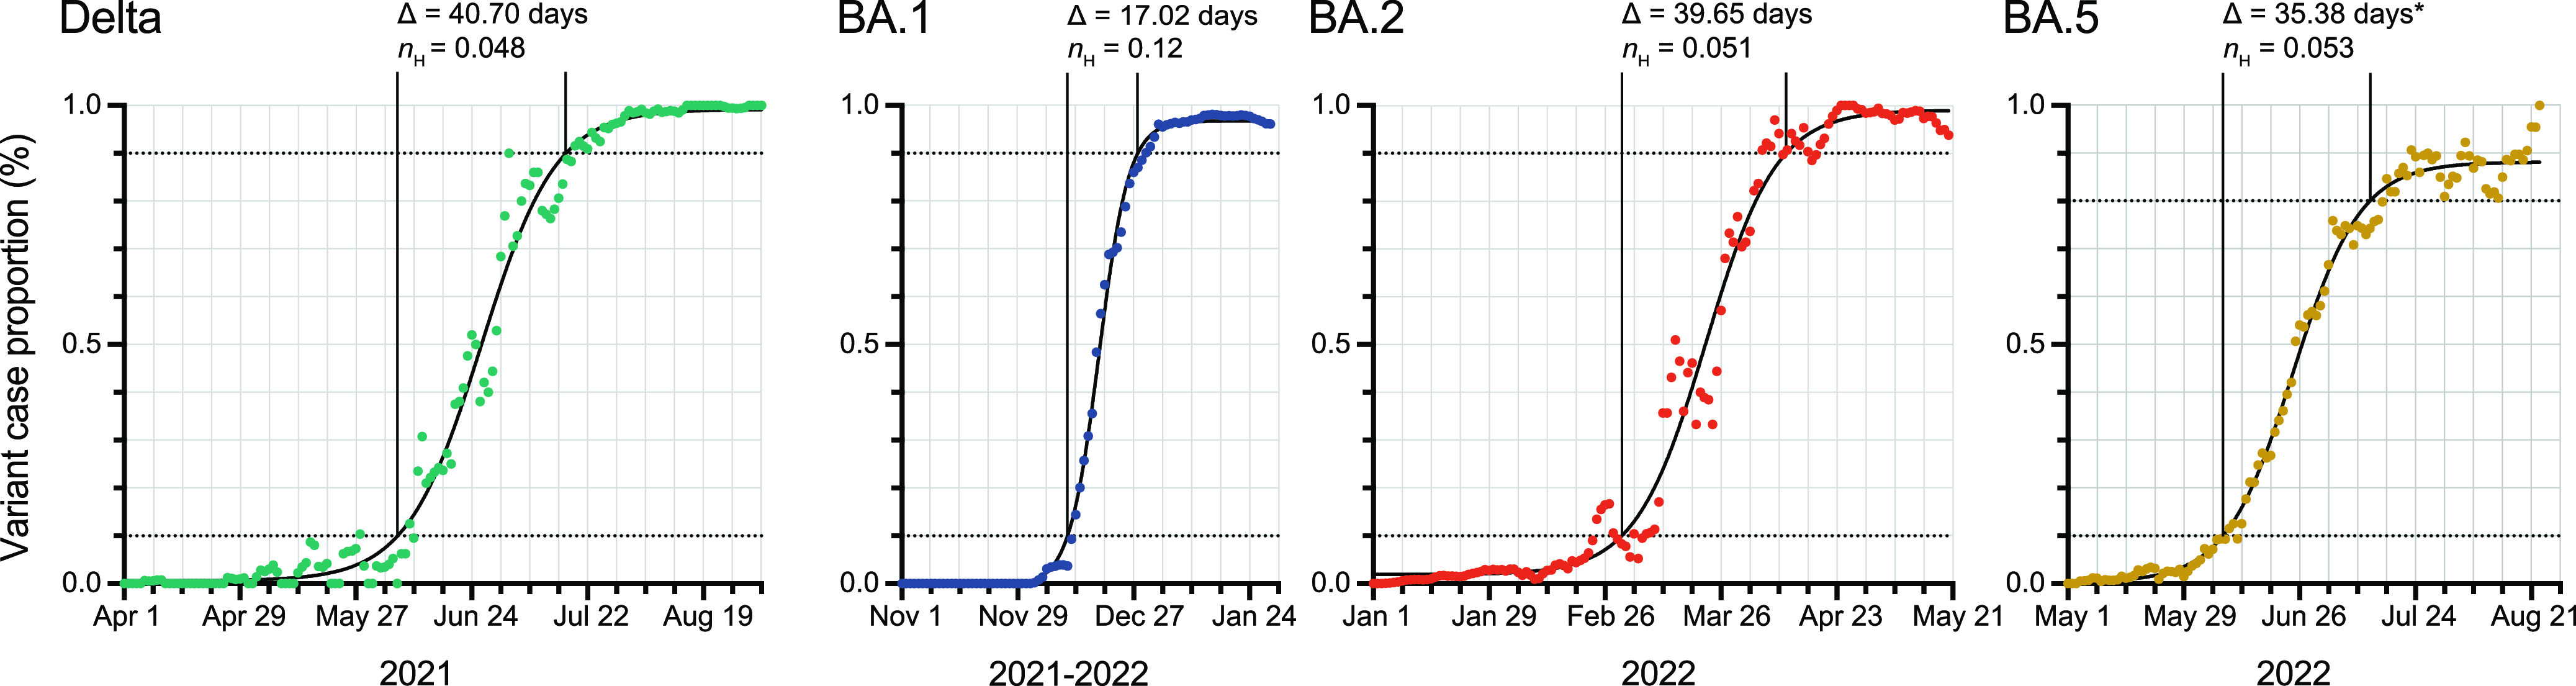
The adaptive evolution of SARS-CoV-2 variants is driven by selection for increased viral fitness in transmissibility and immune evasion. Understanding the dynamics of how an emergent variant sweeps across populations can better inform public health response preparedness for future variants. Here, we investigated the state-level genomic epidemiology of SARS-CoV-2 through baseline genomic sequencing surveillance of 27,071 public testing specimens and 1,125 hospital inpatient specimens diagnosed between November 1, 2021, and January 31, 2022, in Arizona. We found that the Omicron variant rapidly displaced Delta variant in December 2021, leading to an "Omicron surge" of COVID-19 cases in early 2022. Wastewater sequencing surveillance of 370 samples supported the synchronous sweep of Omicron in the community. Hospital inpatient COVID-19 cases of Omicron variant presented to three major hospitals 10.51 days after its detection from public clinical testing. Nonsynonymous mutations in nsp3, nsp12, and nsp13 genes were significantly associated with Omicron hospital cases compared to community cases. To model SARS-CoV-2 transmissions across the state population, we developed a scalable sequence network methodology and showed that the Omicron variant spread through intracounty and intercounty transmissions. Finally, we demonstrated that the temporal emergence of Omicron BA.1 to become the dominant variant (17.02 days) was 2.3 times faster than the prior Delta variant (40.70 days) or subsequent Omicron sublineages BA.2 (39.65 days) and BA.5 (35.38 days). Our results demonstrate the uniquely rapid sweep of Omicron BA.1. These findings highlight how integrated public health surveillance can be used to enhance preparedness and response to future variants. IMPORTANCE SARS-CoV-2 continues to evolve new variants throughout the pandemic. However, the temporal dynamics of how SARS-CoV-2 variants emerge to become the dominant circulating variant is not precisely known. Genomic sequencing surveillance offers unique insights into how SARS-CoV-2 spreads in communities and the lead-up to hospital cases during a surge. Specifically, baseline sequencing surveillance through random selection of positive diagnostic specimens provides a representative outlook of the virus lineages circulating in a geographic region. Here, we investigated the emergence of the Omicron variant of concern in Arizona by leveraging baseline genomic sequence surveillance of public clinical testing, hospitals, and community wastewater. We tracked the spread and evolution of the Omicron variant as it first emerged in the general public, and its rapid shift in hospital admissions in the state health system. This study demonstrates the timescale of public health preparedness needed to respond to an antigenic shift in SARS-CoV-2.
Keywords: Omicron variant; SARS-CoV-2; emergence dynamics; hospital-associated mutations; wastewater surveillance.
Conflict of interest statement
The authors declare a conflict of interest. R.U.H. and E.M.D. are cofounders of AquaVitas, LLC, Scottsdale, AZ, USA, an Arizona State University startup company providing commercial services in wastewater-based epidemiology. R.U.H. is the founder of OneWaterOneHealth, a non-profit project of the Arizona State University Foundation.
Figures
Similar articles
-
Wastewater Genomic Surveillance Captures Early Detection of Omicron in Utah.Microbiol Spectr. 2023 Jun 15;11(3):e0039123. doi: 10.1128/spectrum.00391-23. Epub 2023 May 8. Microbiol Spectr. 2023. PMID: 37154725 Free PMC article.
-
SARS-CoV-2 wastewater monitoring using a novel PCR-based method rapidly captured the Delta-to-Omicron ΒΑ.1 transition patterns in the absence of conventional surveillance evidence.Sci Total Environ. 2022 Oct 20;844:156932. doi: 10.1016/j.scitotenv.2022.156932. Epub 2022 Jun 24. Sci Total Environ. 2022. PMID: 35753493 Free PMC article.
-
Unraveling the Dynamics of Omicron (BA.1, BA.2, and BA.5) Waves and Emergence of the Deltacton Variant: Genomic Epidemiology of the SARS-CoV-2 Epidemic in Cyprus (Oct 2021-Oct 2022).Viruses. 2023 Sep 15;15(9):1933. doi: 10.3390/v15091933. Viruses. 2023. PMID: 37766339 Free PMC article.
-
Omicron variant (B.1.1.529) and its sublineages: What do we know so far amid the emergence of recombinant variants of SARS-CoV-2?Biomed Pharmacother. 2022 Oct;154:113522. doi: 10.1016/j.biopha.2022.113522. Epub 2022 Aug 15. Biomed Pharmacother. 2022. PMID: 36030585 Free PMC article. Review.
-
Evolution of the SARS-CoV-2 omicron variants BA.1 to BA.5: Implications for immune escape and transmission.Rev Med Virol. 2022 Sep;32(5):e2381. doi: 10.1002/rmv.2381. Epub 2022 Jul 20. Rev Med Virol. 2022. PMID: 35856385 Free PMC article. Review.
Cited by
-
Digital PCR Discriminates between SARS-CoV-2 Omicron Variants and Immune Escape Mutations.Microbiol Spectr. 2023 Aug 17;11(4):e0525822. doi: 10.1128/spectrum.05258-22. Epub 2023 Jun 12. Microbiol Spectr. 2023. PMID: 37306573 Free PMC article.
-
Longitudinal dynamics of the nasopharyngal microbiome in response to SARS-CoV-2 Omicron variant and HIV infection in Kenyan women and their infants.Res Sq [Preprint]. 2024 Apr 17:rs.3.rs-4257641. doi: 10.21203/rs.3.rs-4257641/v1. Res Sq. 2024. Update in: mSystems. 2025 May 20;10(5):e0156824. doi: 10.1128/msystems.01568-24. PMID: 38699359 Free PMC article. Updated. Preprint.
-
Influenza Virus Genomic Surveillance, Arizona, USA, 2023-2024.Viruses. 2024 Apr 27;16(5):692. doi: 10.3390/v16050692. Viruses. 2024. PMID: 38793574 Free PMC article.
-
A Strategic Framework of SARS-CoV-2 Genomic Surveillance in Bangladesh.Influenza Other Respir Viruses. 2024 Oct;18(10):e70019. doi: 10.1111/irv.70019. Influenza Other Respir Viruses. 2024. PMID: 39440811 Free PMC article.
-
Real-Time Monitoring of SARS-CoV-2 Variants in Oklahoma Wastewater through Allele-Specific RT-qPCR.Microorganisms. 2024 Sep 30;12(10):2001. doi: 10.3390/microorganisms12102001. Microorganisms. 2024. PMID: 39458310 Free PMC article.
References
-
- Zhu N, Zhang D, Wang W, Li X, Yang B, Song J, Zhao X, Huang B, Shi W, Lu R, Niu P, Zhan F, Ma X, Wang D, Xu W, Wu G, Gao GF, Tan W. China Novel Coronavirus I, Research T. 2020. A novel coronavirus from patients with pneumonia in China, 2019. N Engl J Med 382:727–733. doi:10.1056/NEJMoa2001017. - DOI - PMC - PubMed
-
- Volz E, Mishra S, Chand M, Barrett JC, Johnson R, Geidelberg L, Hinsley WR, Laydon DJ, Dabrera G, O'Toole A, Amato R, Ragonnet-Cronin M, Harrison I, Jackson B, Ariani CV, Boyd O, Loman NJ, McCrone JT, Goncalves S, Jorgensen D, Myers R, Hill V, Jackson DK, Gaythorpe K, Groves N, Sillitoe J, Kwiatkowski DP, Consortium C-GU, Flaxman S, Ratmann O, Bhatt S, Hopkins S, Gandy A, Rambaut A, Ferguson NM. COVID-19 Genomics UK (COG-UK) consortium. 2021. Assessing transmissibility of SARS-CoV-2 lineage B.1.1.7 in England. Nature 593:266–269. doi:10.1038/s41586-021-03470-x. - DOI - PubMed
-
- Ong SWX, Chiew CJ, Ang LW, Mak TM, Cui L, Toh M, Lim YD, Lee PH, Lee TH, Chia PY, Maurer-Stroh S, Lin RTP, Leo YS, Lee VJ, Lye DC, Young BE. 2021. Clinical and virological features of SARS-CoV-2 variants of concern: a retrospective cohort study comparing B.1.1.7 (Alpha), B.1.315 (Beta), and B.1.617.2 (Delta). Clin Infect Dis 75:e1128–e1136. doi:10.1093/cid/ciab721. - DOI - PMC - PubMed
-
- Davies NG, Abbott S, Barnard RC, Jarvis CI, Kucharski AJ, Munday JD, Pearson CAB, Russell TW, Tully DC, Washburne AD, Wenseleers T, Gimma A, Waites W, Wong KLM, van Zandvoort K, Silverman JD, Group CC-W, Consortium C-GU, Diaz-Ordaz K, Keogh R, Eggo RM, Funk S, Jit M, Atkins KE, Edmunds WJ. CMMID COVID-19 Working Group. 2021. Estimated transmissibility and impact of SARS-CoV-2 lineage B.1.1.7 in England. Science 372:eabg3055. doi:10.1126/science.abg3055. - DOI - PMC - PubMed
Publication types
MeSH terms
Substances
Supplementary concepts
Grants and funding
LinkOut - more resources
Full Text Sources
Medical
Miscellaneous
