. 2023 Apr;21(2):457-468.
doi: 10.1007/s12021-022-09616-0. Epub 2023 Jan 9.

NiftyPAD - Novel Python Package for Quantitative Analysis of Dynamic PET Data

Affiliations

NiftyPAD - Novel Python Package for Quantitative Analysis of Dynamic PET Data

Jieqing Jiao et al. Neuroinformatics. 2023 Apr.

Abstract

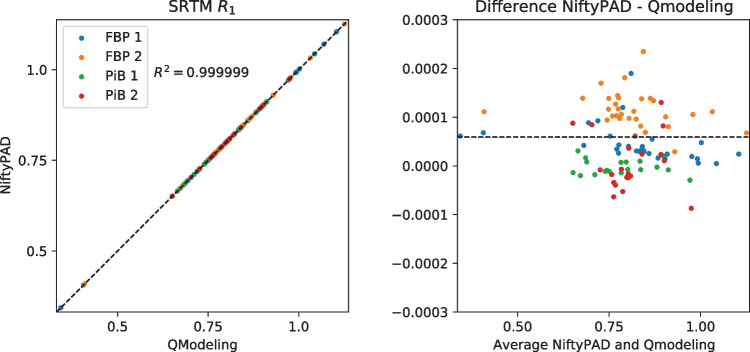
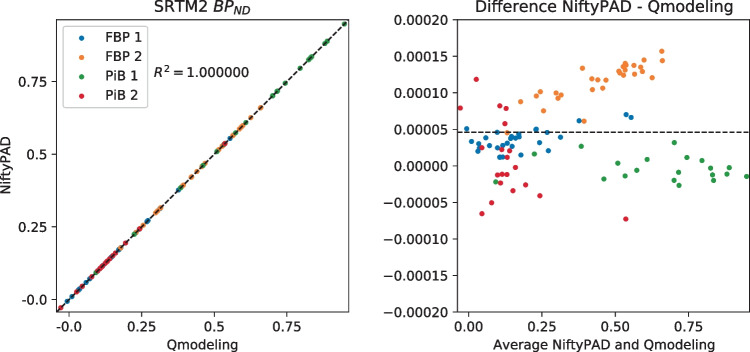
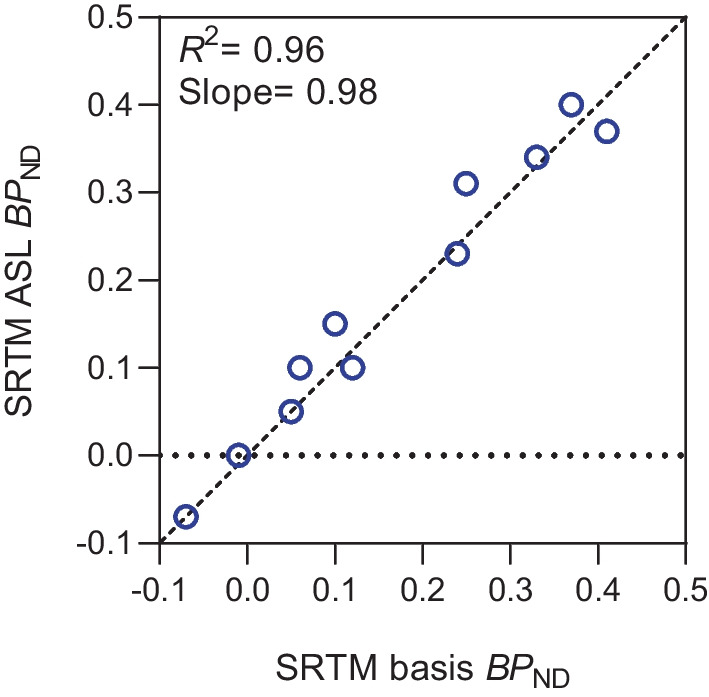
Current PET datasets are becoming larger, thereby increasing the demand for fast and reproducible processing pipelines. This paper presents a freely available, open source, Python-based software package called NiftyPAD, for versatile analyses of static, full or dual-time window dynamic brain PET data. The key novelties of NiftyPAD are the analyses of dual-time window scans with reference input processing, pharmacokinetic modelling with shortened PET acquisitions through the incorporation of arterial spin labelling (ASL)-derived relative perfusion measures, as well as optional PET data-based motion correction. Results obtained with NiftyPAD were compared with the well-established software packages PPET and QModeling for a range of kinetic models. Clinical data from eight subjects scanned with four different amyloid tracers were used to validate the computational performance. NiftyPAD achieved [Formula: see text] correlation with PPET, with absolute difference [Formula: see text] for linearised Logan and MRTM2 methods, and [Formula: see text] correlation with QModeling, with absolute difference [Formula: see text] for basis function based SRTM and SRTM2 models. For the recently published SRTM ASL method, which is unavailable in existing software packages, high correlations with negligible bias were observed with the full scan SRTM in terms of non-displaceable binding potential ([Formula: see text]), indicating reliable model implementation in NiftyPAD. Together, these findings illustrate that NiftyPAD is versatile, flexible, and produces comparable results with established software packages for quantification of dynamic PET data. It is freely available ( https://github.com/AMYPAD/NiftyPAD ), and allows for multi-platform usage. The modular setup makes adding new functionalities easy, and the package is lightweight with minimal dependencies, making it easy to use and integrate into existing processing pipelines.

Keywords: NiftyPAD; PET; Pharmacokinetic analysis; Python package; Reference input-based modelling.


Conflict of interest statement

The authors have no competing interests to declare that are relevant to the content of this article.

Figures

Fig. 1
Fig. 1
Features of NiftyPAD and its workflow. The features and functions NiftyPAD provides are shaded in formula image 
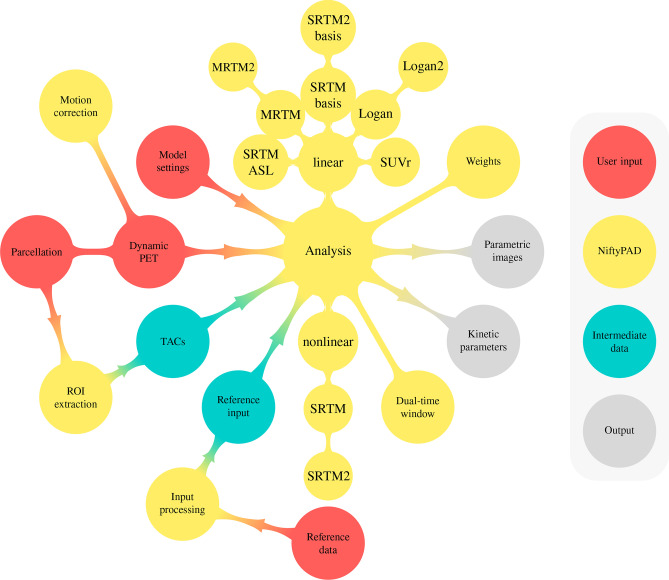
, including optional motion correction, reference input processing, a group of kinetic modelling methods and weighting schemes for analysing dynamic PET data. The required user inputs are shaded in formula image , the intermediate data in formula image , and the resulting outcome measures in formula image
Fig. 2
Fig. 2
Interpolation of reference tissue TAC from one [18F]florbetaben scan with dual-time window acquisition, using A cubic interpolation, B exponential interpolation, and C Feng’s plasma input + 1TC model. Reference tissue input processing serves as an essential first step before kinetic analysis of dual-time window PET scans
Fig. 3
Fig. 3
Correlation and Bland-Altman plots of the BPND values computed by NiftyPAD and PPET using the Logan reference model. Data points correspond to different brain regions from each subject. The dashed lines are the line of identity on the left, and the mean difference on the right
Fig. 4
Fig. 4
Correlation and Bland-Altman plots of the BPND values computed by NiftyPAD and PPET using the MRTM2 model. Data points correspond to different brain regions from each subject. The dashed lines are the line of identity on the left, and the mean difference on the right
Fig. 5
Fig. 5
Correlation and Bland-Altman plots of the BPND values computed by NiftyPAD and QModeling using the SRTM model with basis functions. Data points correspond to different brain regions from each subject. The dashed lines are the line of identity on the left, and the mean difference on the right
Fig. 6
Fig. 6
Correlation and Bland-Altman plots of the R1 values computed by NiftyPAD and QModeling using the SRTM model with basis functions. Data points correspond to different brain regions from each subject. The dashed lines are the line of identity on the left, and the mean difference on the right
Fig. 7
Fig. 7
Correlation and Bland-Altman plots of the BPND values computed by NiftyPAD and QModeling using the SRTM2 model with basis functions. Data points correspond to different brain regions from each subject. The dashed lines are the line of identity on the left, and the mean difference on the right
Fig. 8
Fig. 8
Correlation and Bland-Altman plots of the R1 values computed by NiftyPAD and QModeling using the SRTM2 model with basis functions. Data points correspond to different brain regions from each subject. The dashed lines are the line of identity on the left, and the mean difference on the right
Fig. 9
Fig. 9
Relationship between SRTM basis and SRTM ASL derived BPND. Correlation between BPND derived from two different methods, with R2 and slope parameters corresponding to a linear regression analysis. Dashed line corresponds to the line of identity
Fig. 10
Fig. 10
Parametric BPND images from a [11C]PiB scan derived by the Logan reference model using NiftyPAD and PPET

References

    1. Boellaard R, Yaqub M, Lubberink M, Lammertsma A. Ppet: A software tool for kinetic and parametric analyses of dynamic PET studies. NeuroImage. 2006;31(Supplement 2):62. doi: 10.1016/j.neuroimage.2006.04.053. - DOI
    1. Bullich S, Barthel H, Koglin N, et al. Validation of noninvasive tracer kinetic analysis of 18f-florbetaben PET using a dual-time-window acquisition protocol. Journal of Nuclear Medicine. 2018;59:1104–1110. doi: 10.2967/jnumed.117.200964. - DOI - PubMed
    1. Cecchin D, Barthel H, Poggiali D, et al. A new integrated dual time-point amyloid pet/mri data analysis method. European Journal of Nuclear Medicine and Molecular Imaging. 2017;44:2060–2072. doi: 10.1007/s00259-017-3750-0. - DOI - PubMed
    1. Cohen, A. D., & Klunk, W. E. (2014). Early detection of alzheimer’??s disease using PiB and FDG pet. Neurobiology of Disease, 72, 117–122. - PMC - PubMed
    1. Feng D, Wang X, Yan HA. computer simulation study on the input function sampling schedules in tracer kinetic modeling with positron emission tomography (pet) Computer Methods and Programs in Biomedicine. 1994;45:175–186. doi: 10.1016/0169-2607(94)90201-1. - DOI - PubMed

Publication types

MeSH terms

LinkOut - more resources